INTRODUCTION
In New Jersey, we like to think of ourselves as progressive and forward thinking. And in many ways, we are.
It is also true that Black and other people of color in New Jersey confront some of the worst racial disparities in the United States. One of most racially diverse and prosperous states in the country is also one of its most inequitable.
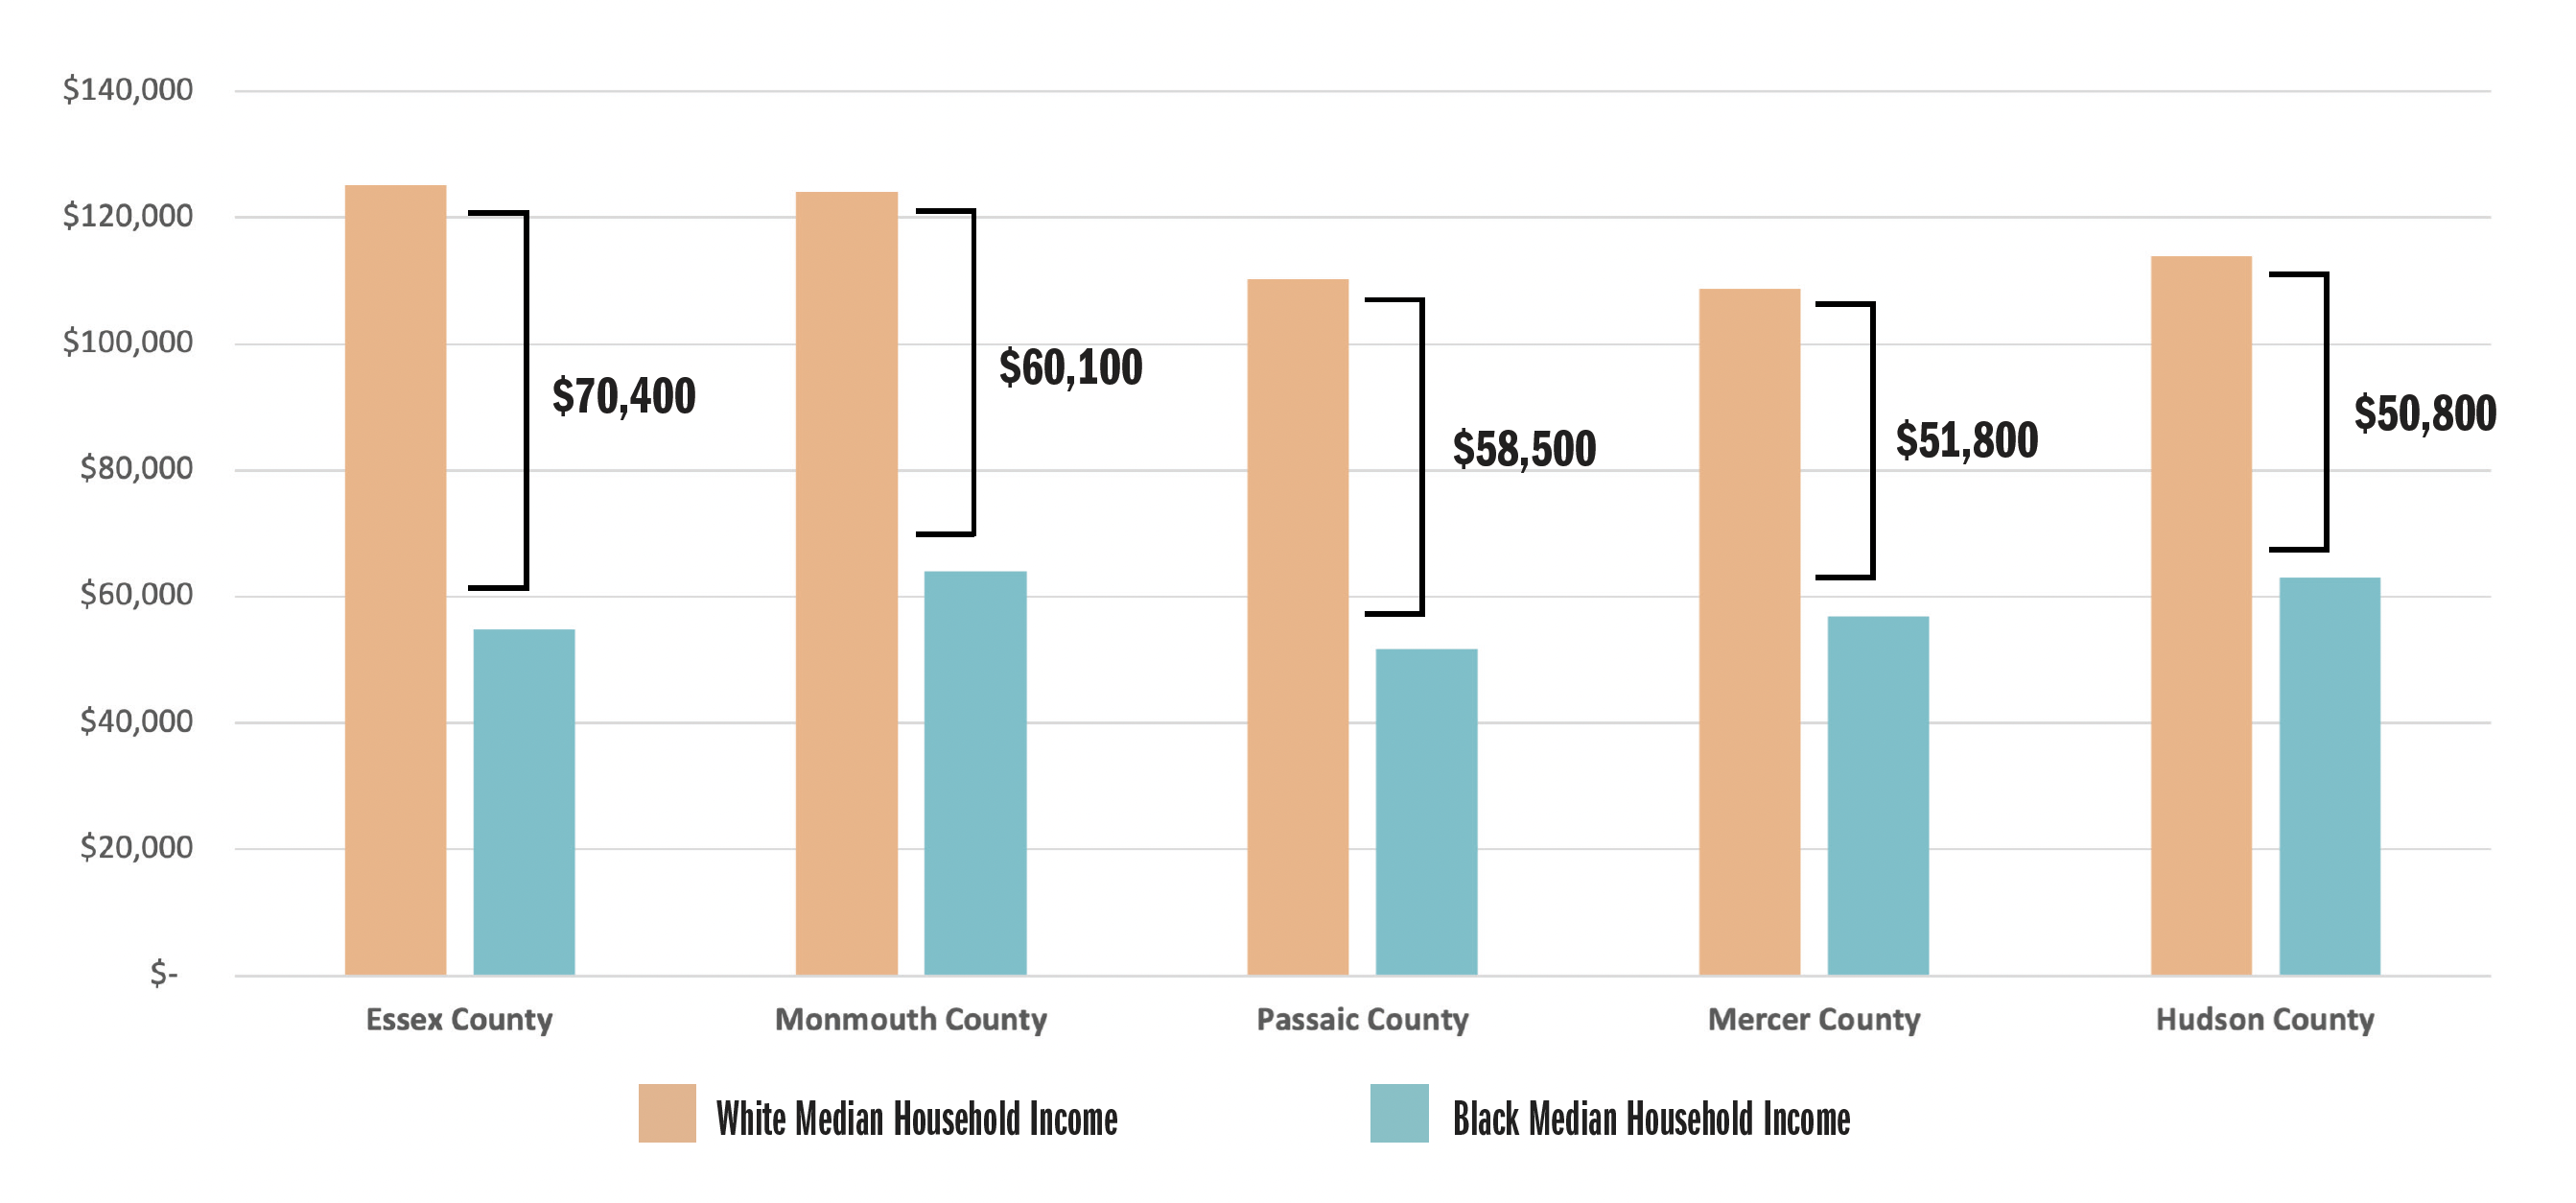
New Jersey’s racial disparities are particularly staggering in the area of economic security, with the state serving as a modern-day version of Dr. Martin Luther King Jr.’s “Two Americas.” In white New Jersey, the median household wealth is $322,500. But the median household wealth in Black and Latina/o New Jersey is just $17,700 and $26,100, respectively — a nearly $300,000 racial wealth gap.
We are, indeed, a State of Inequity.
But why?
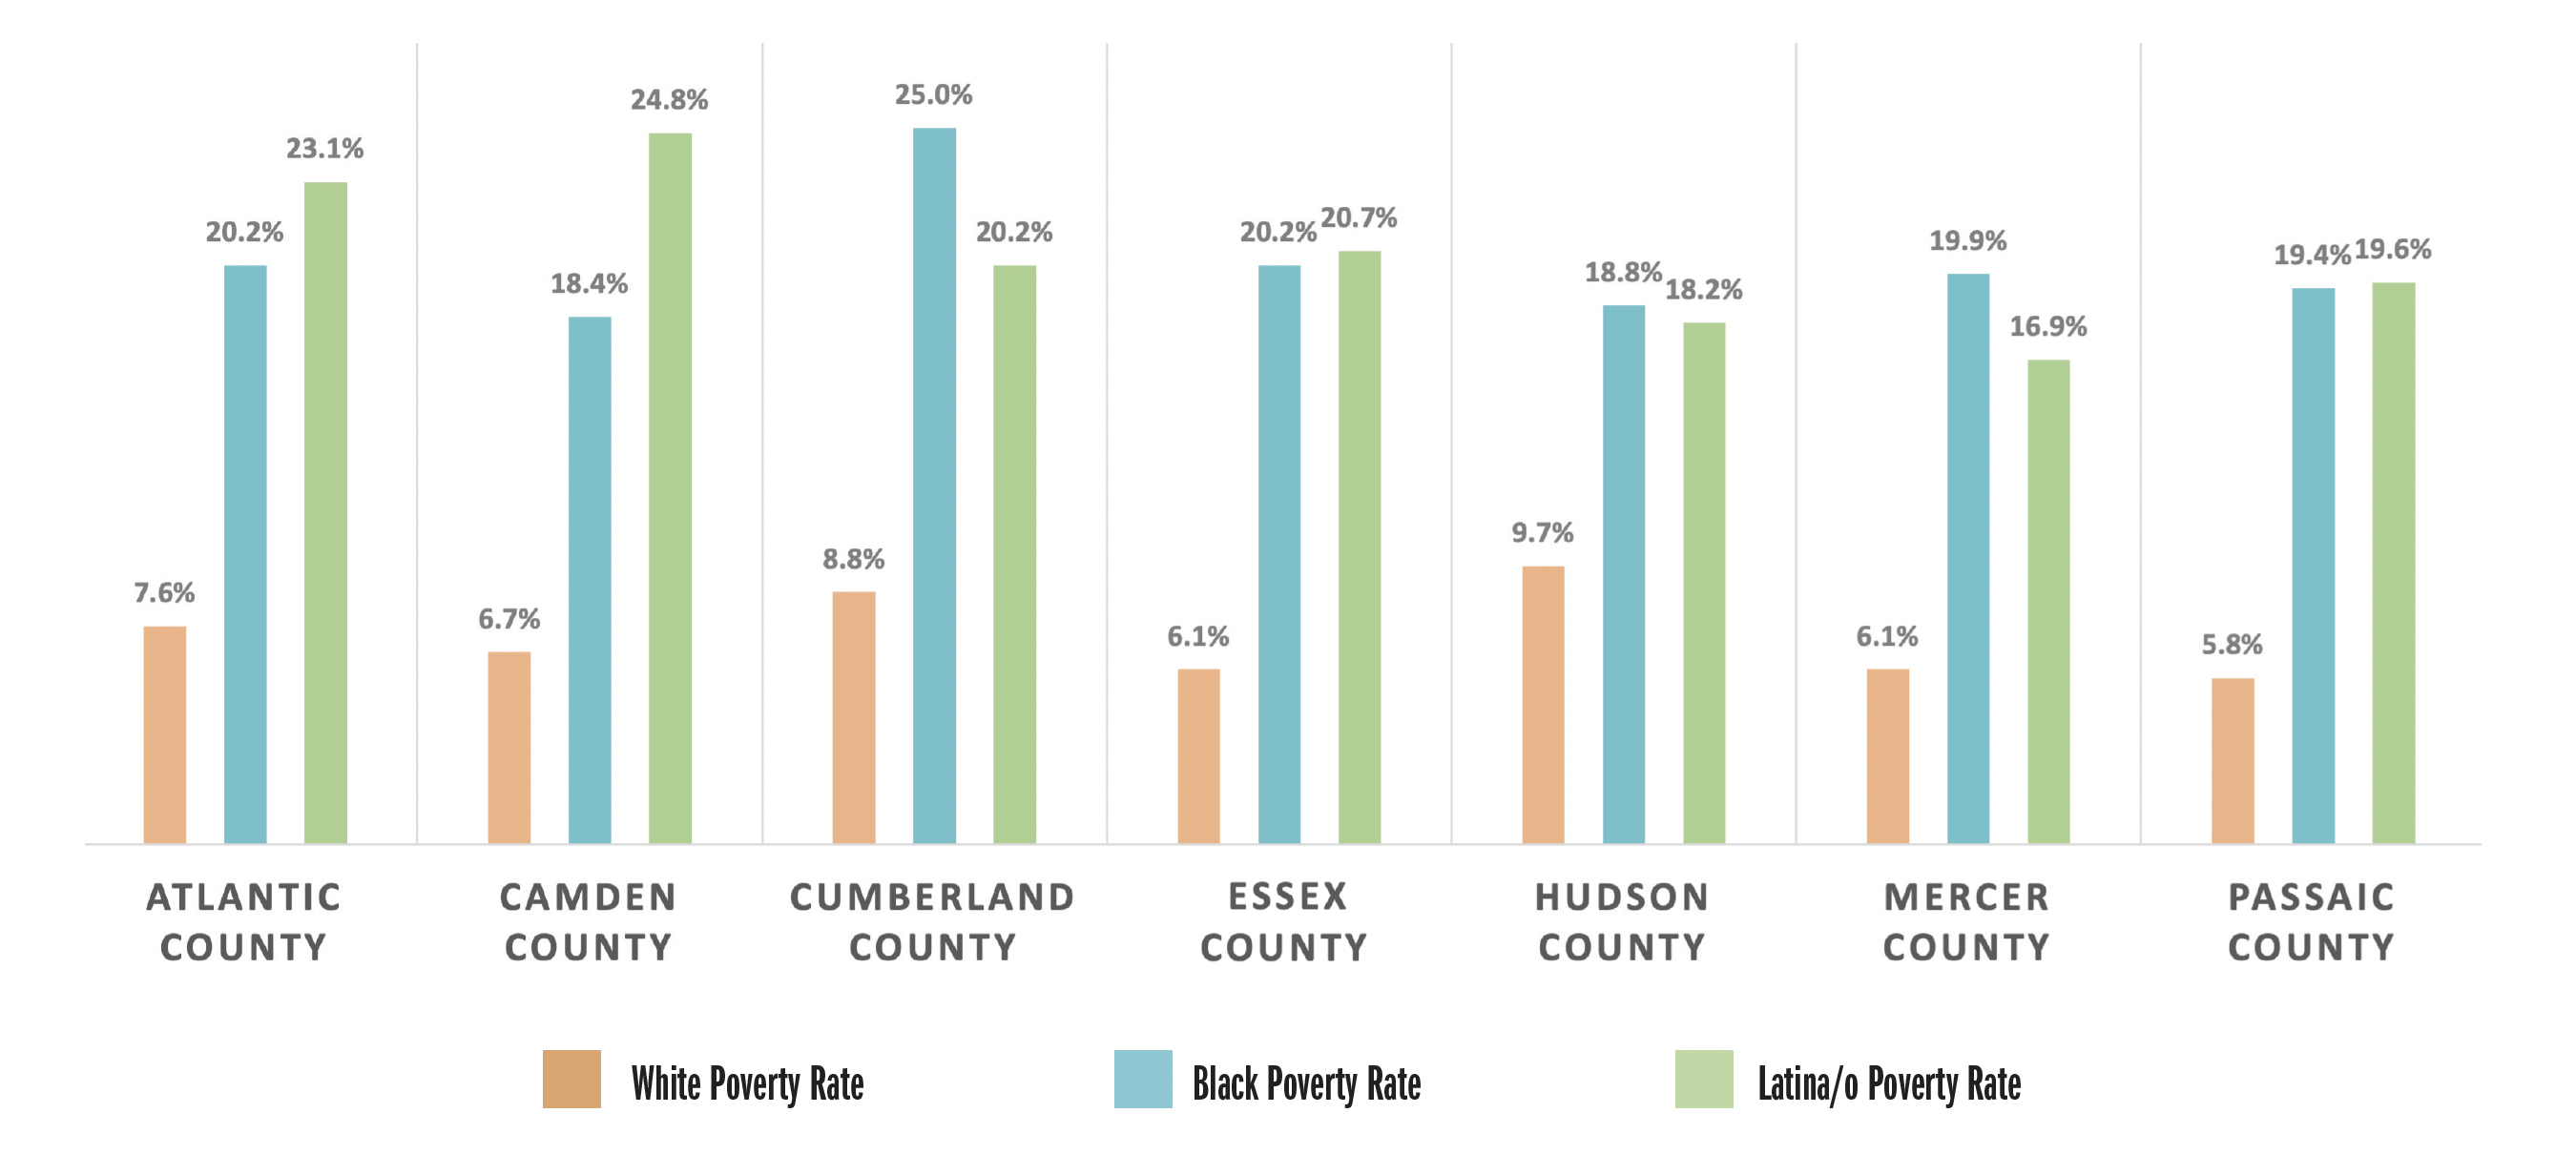
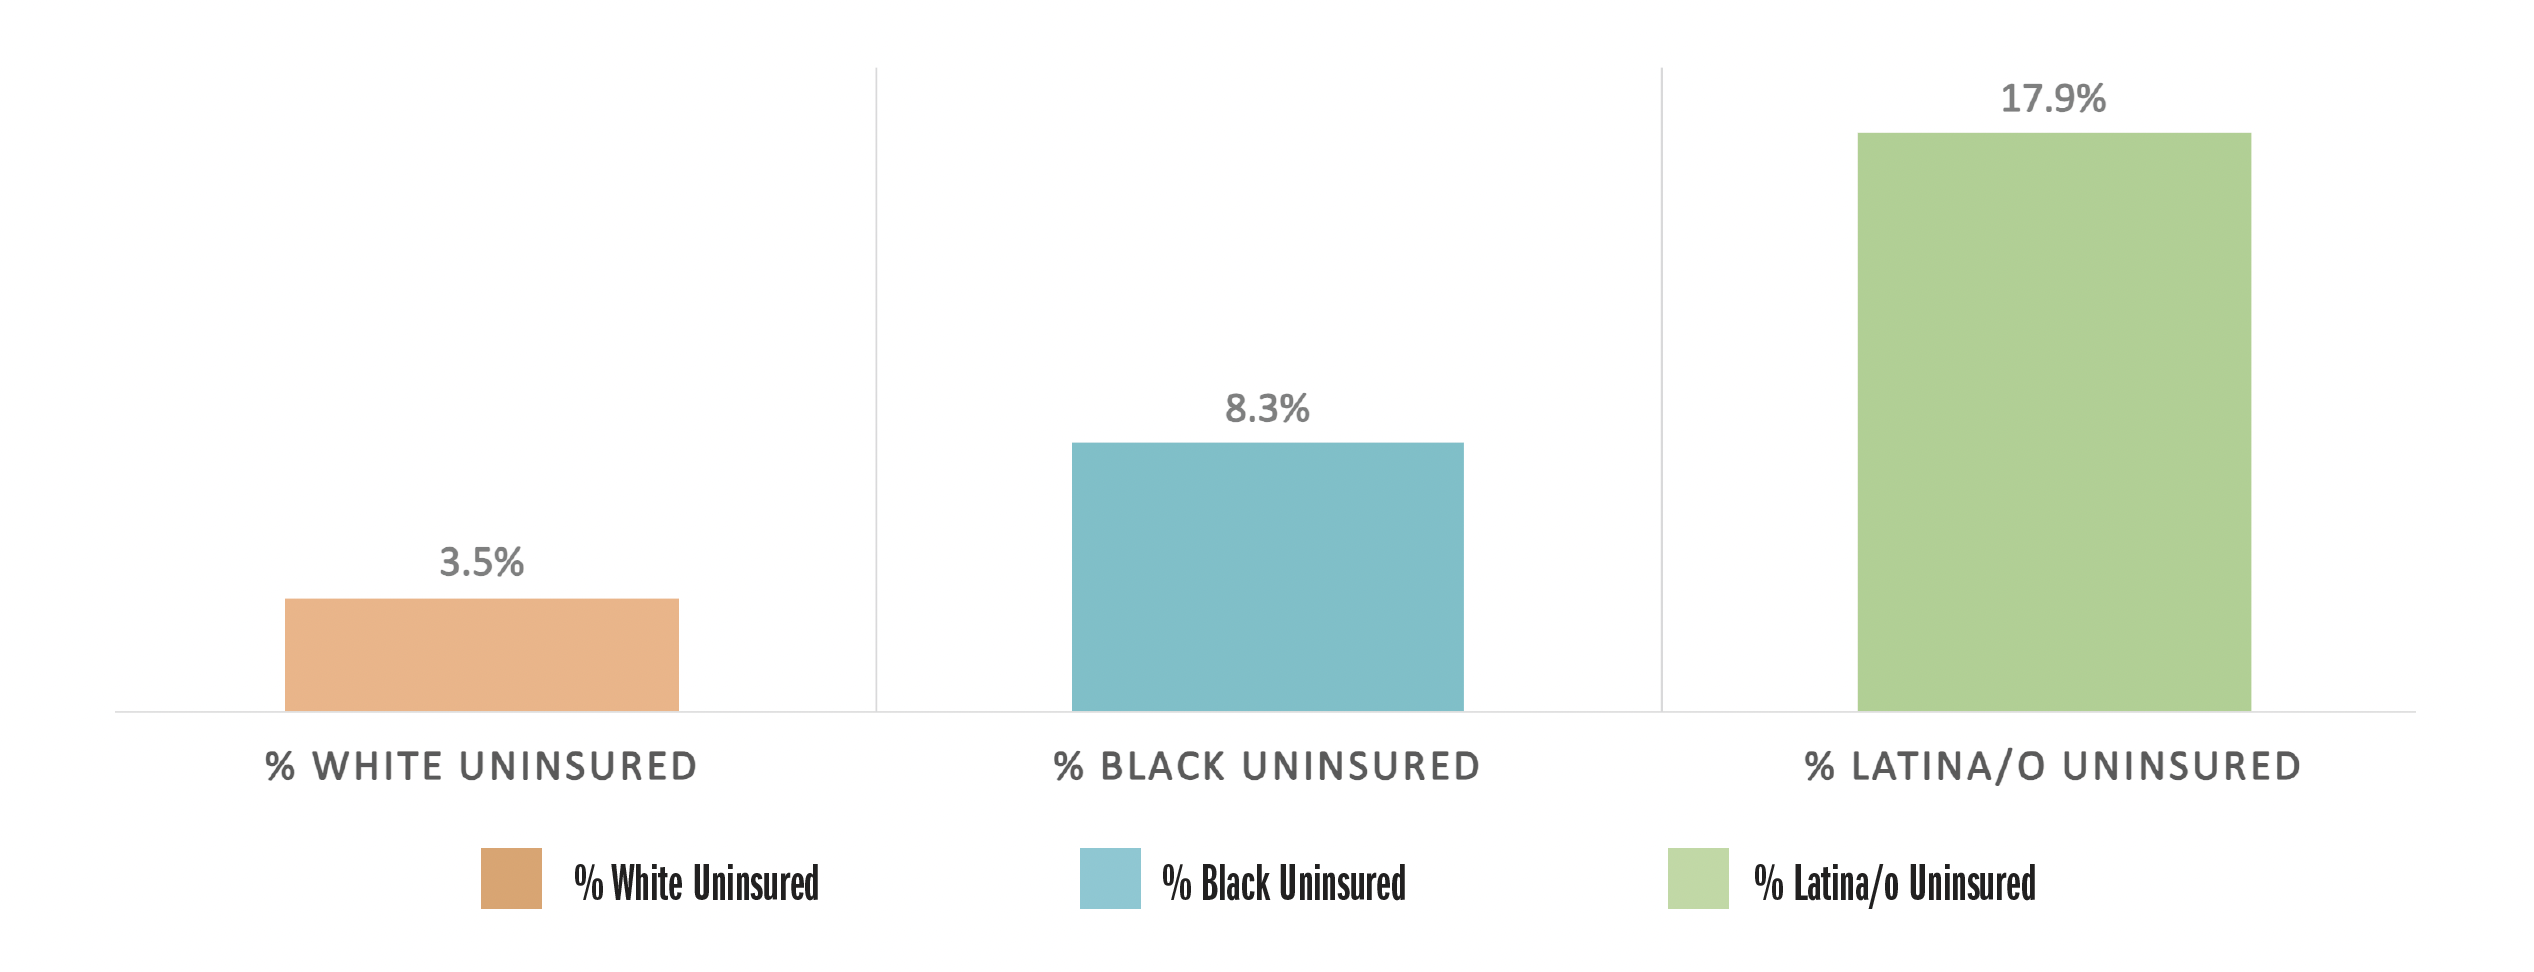
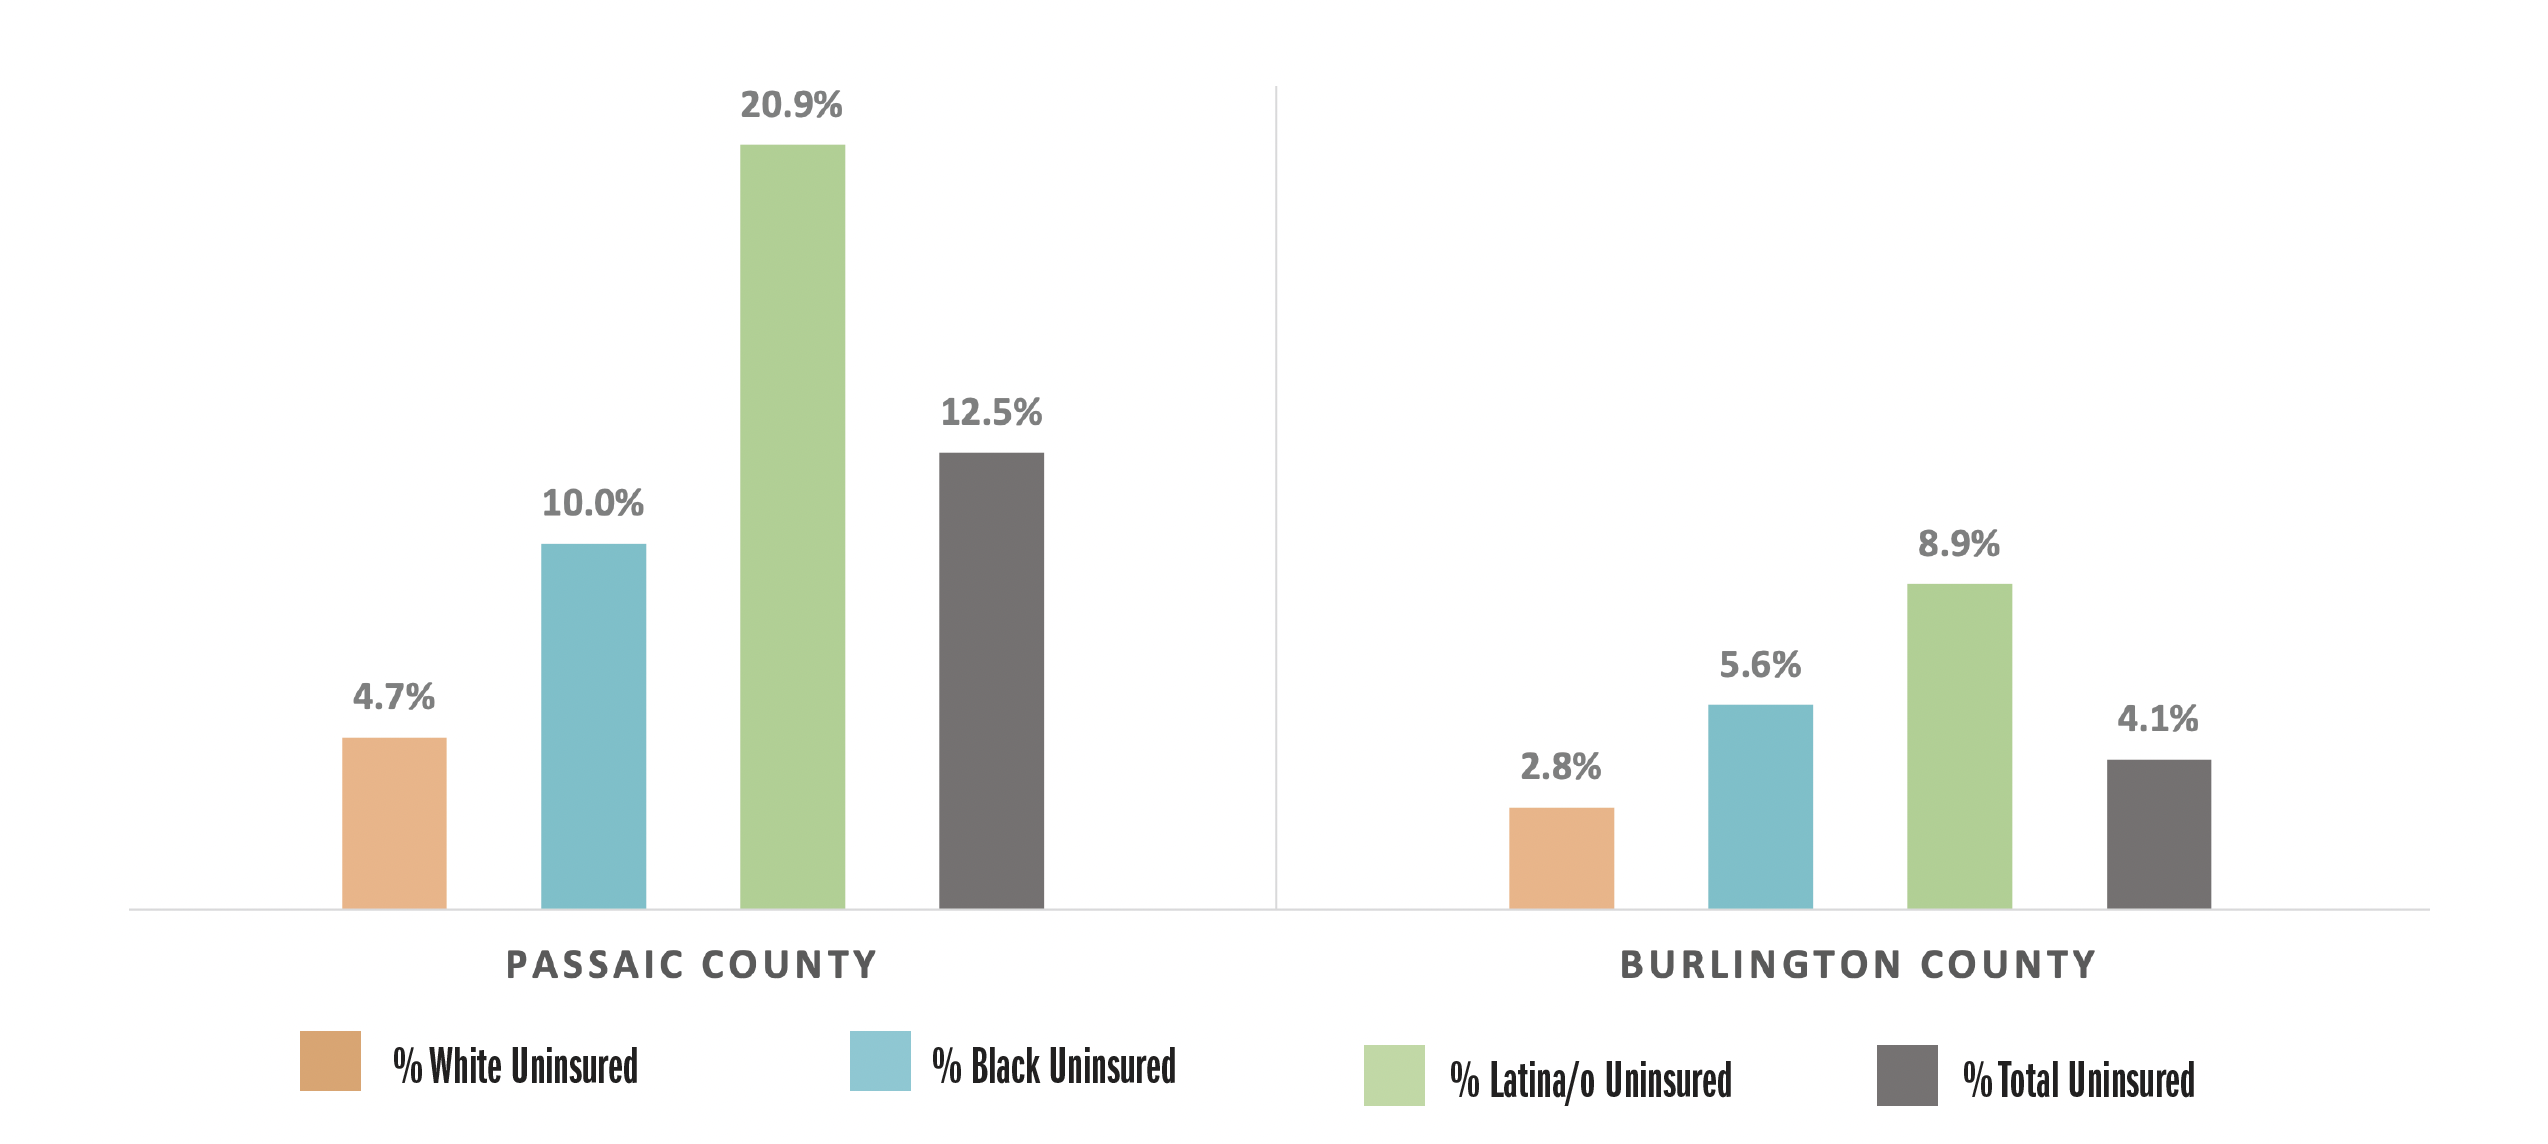
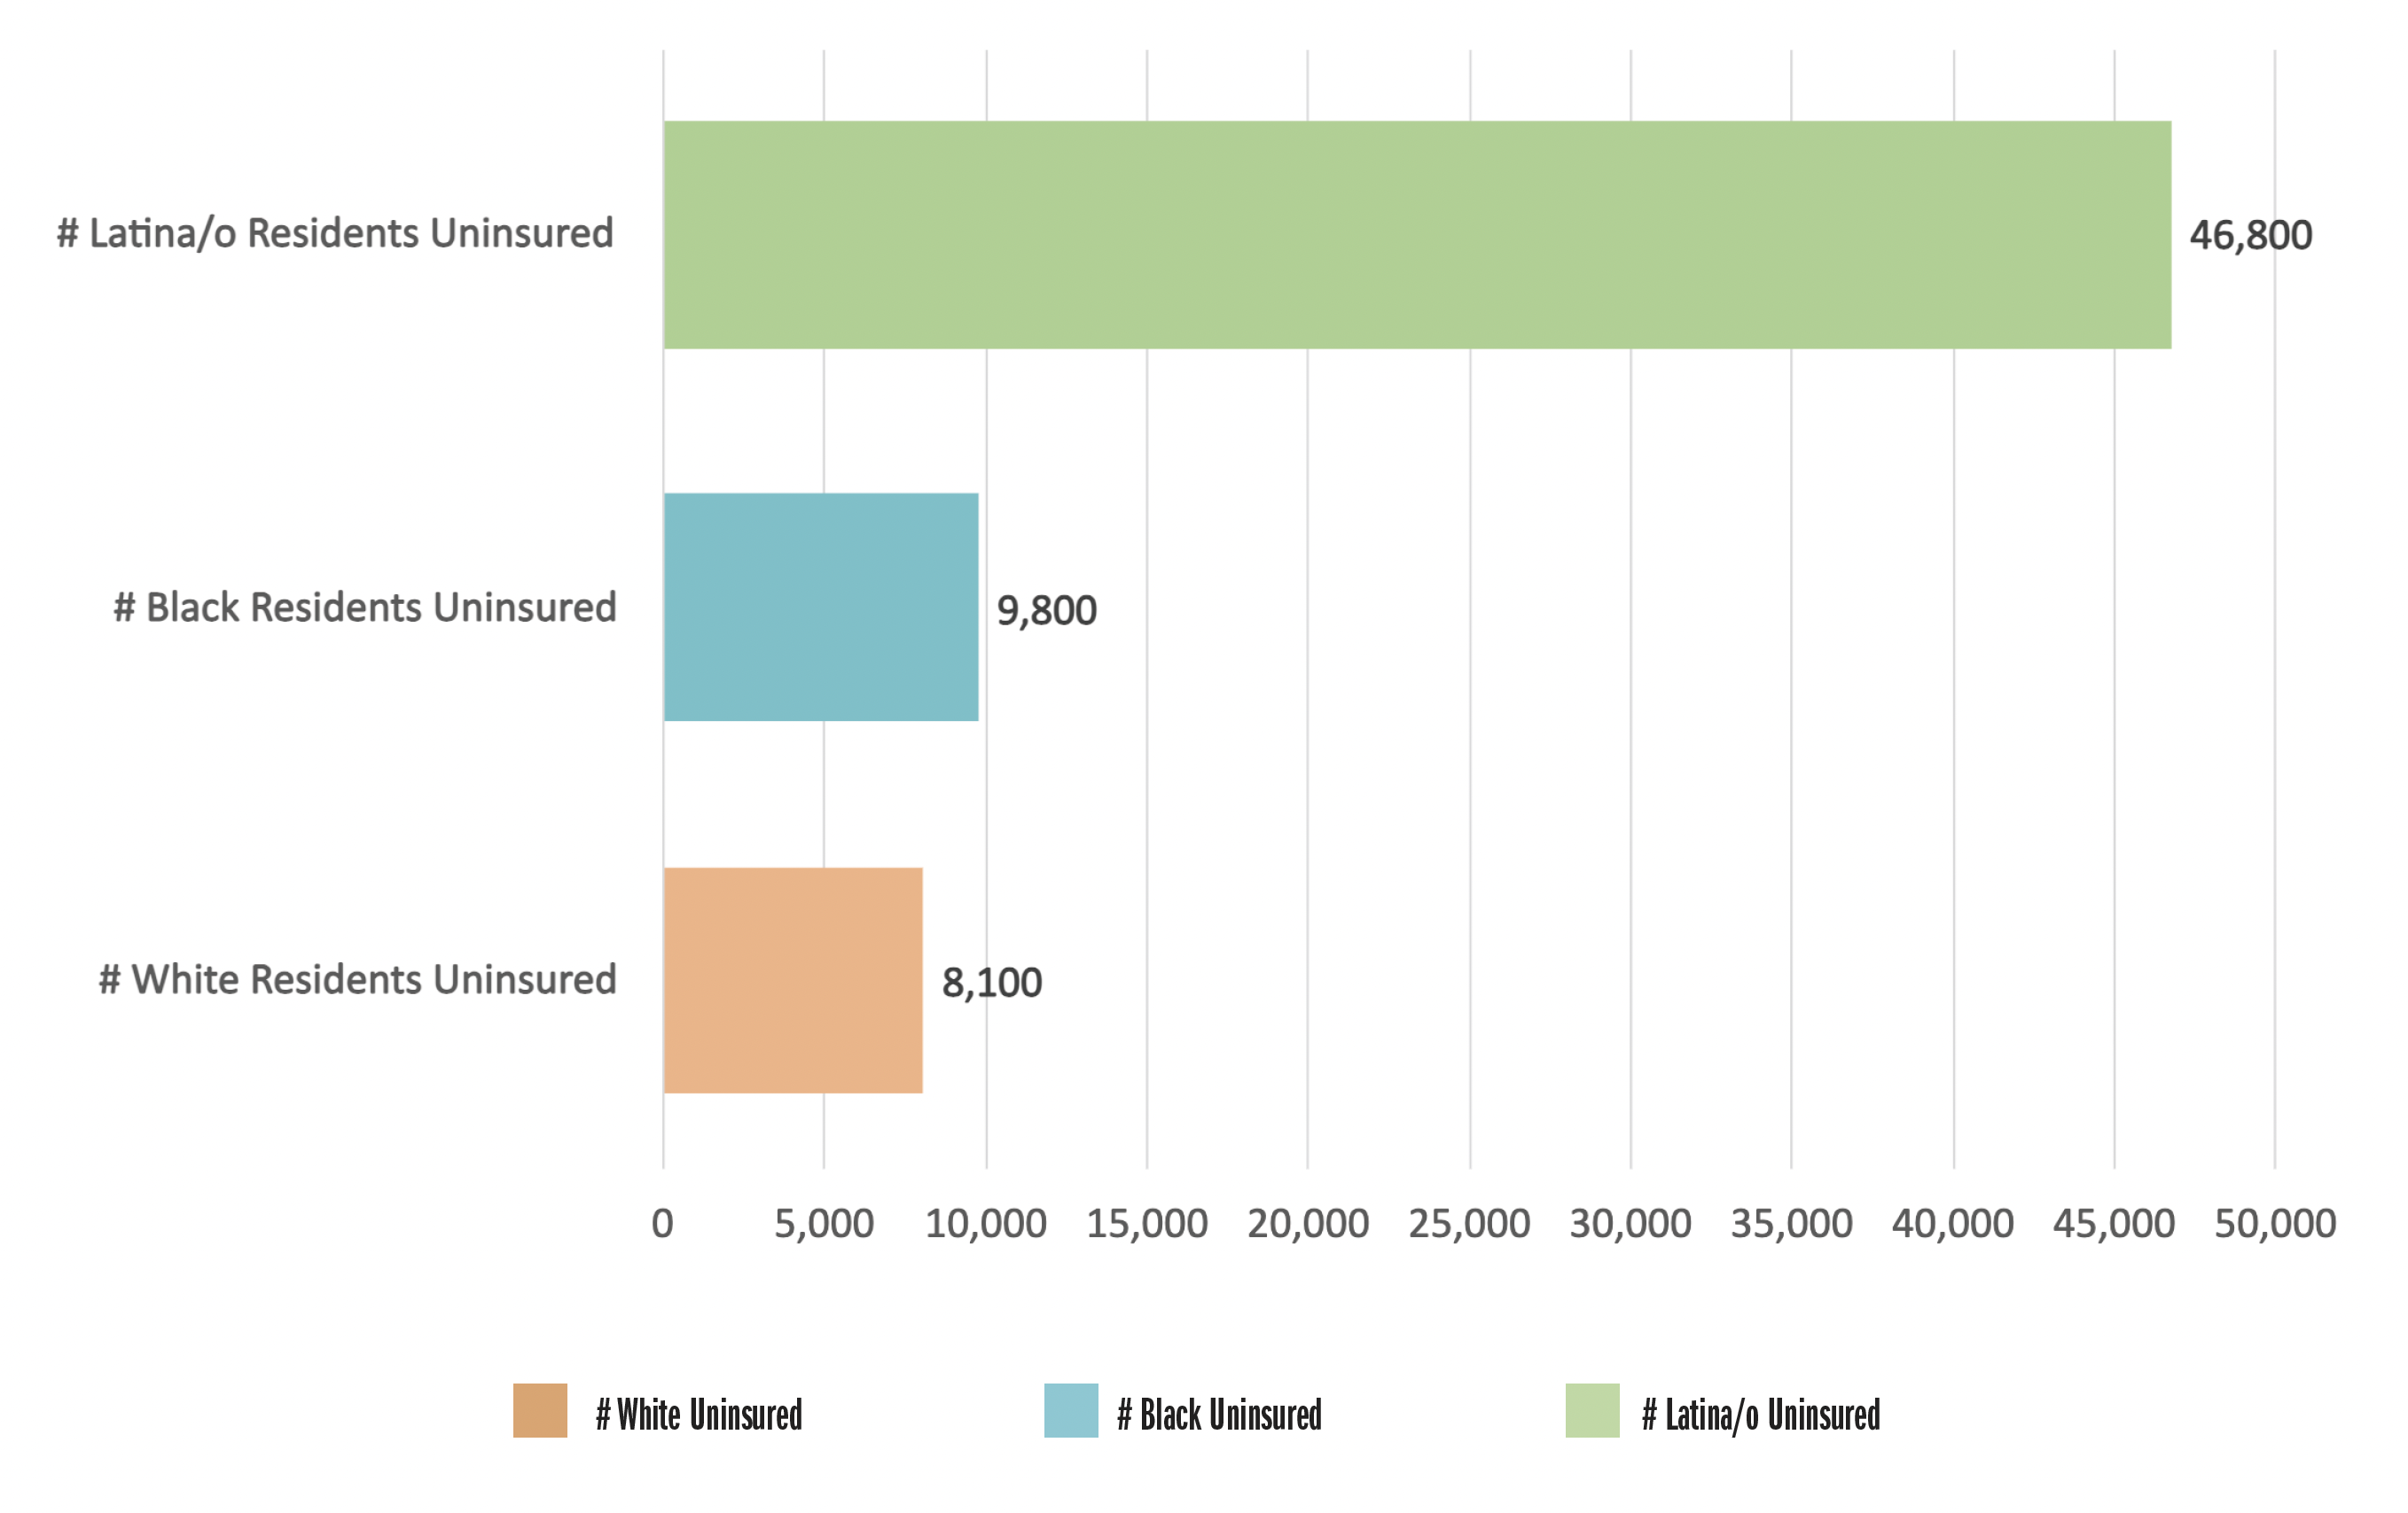
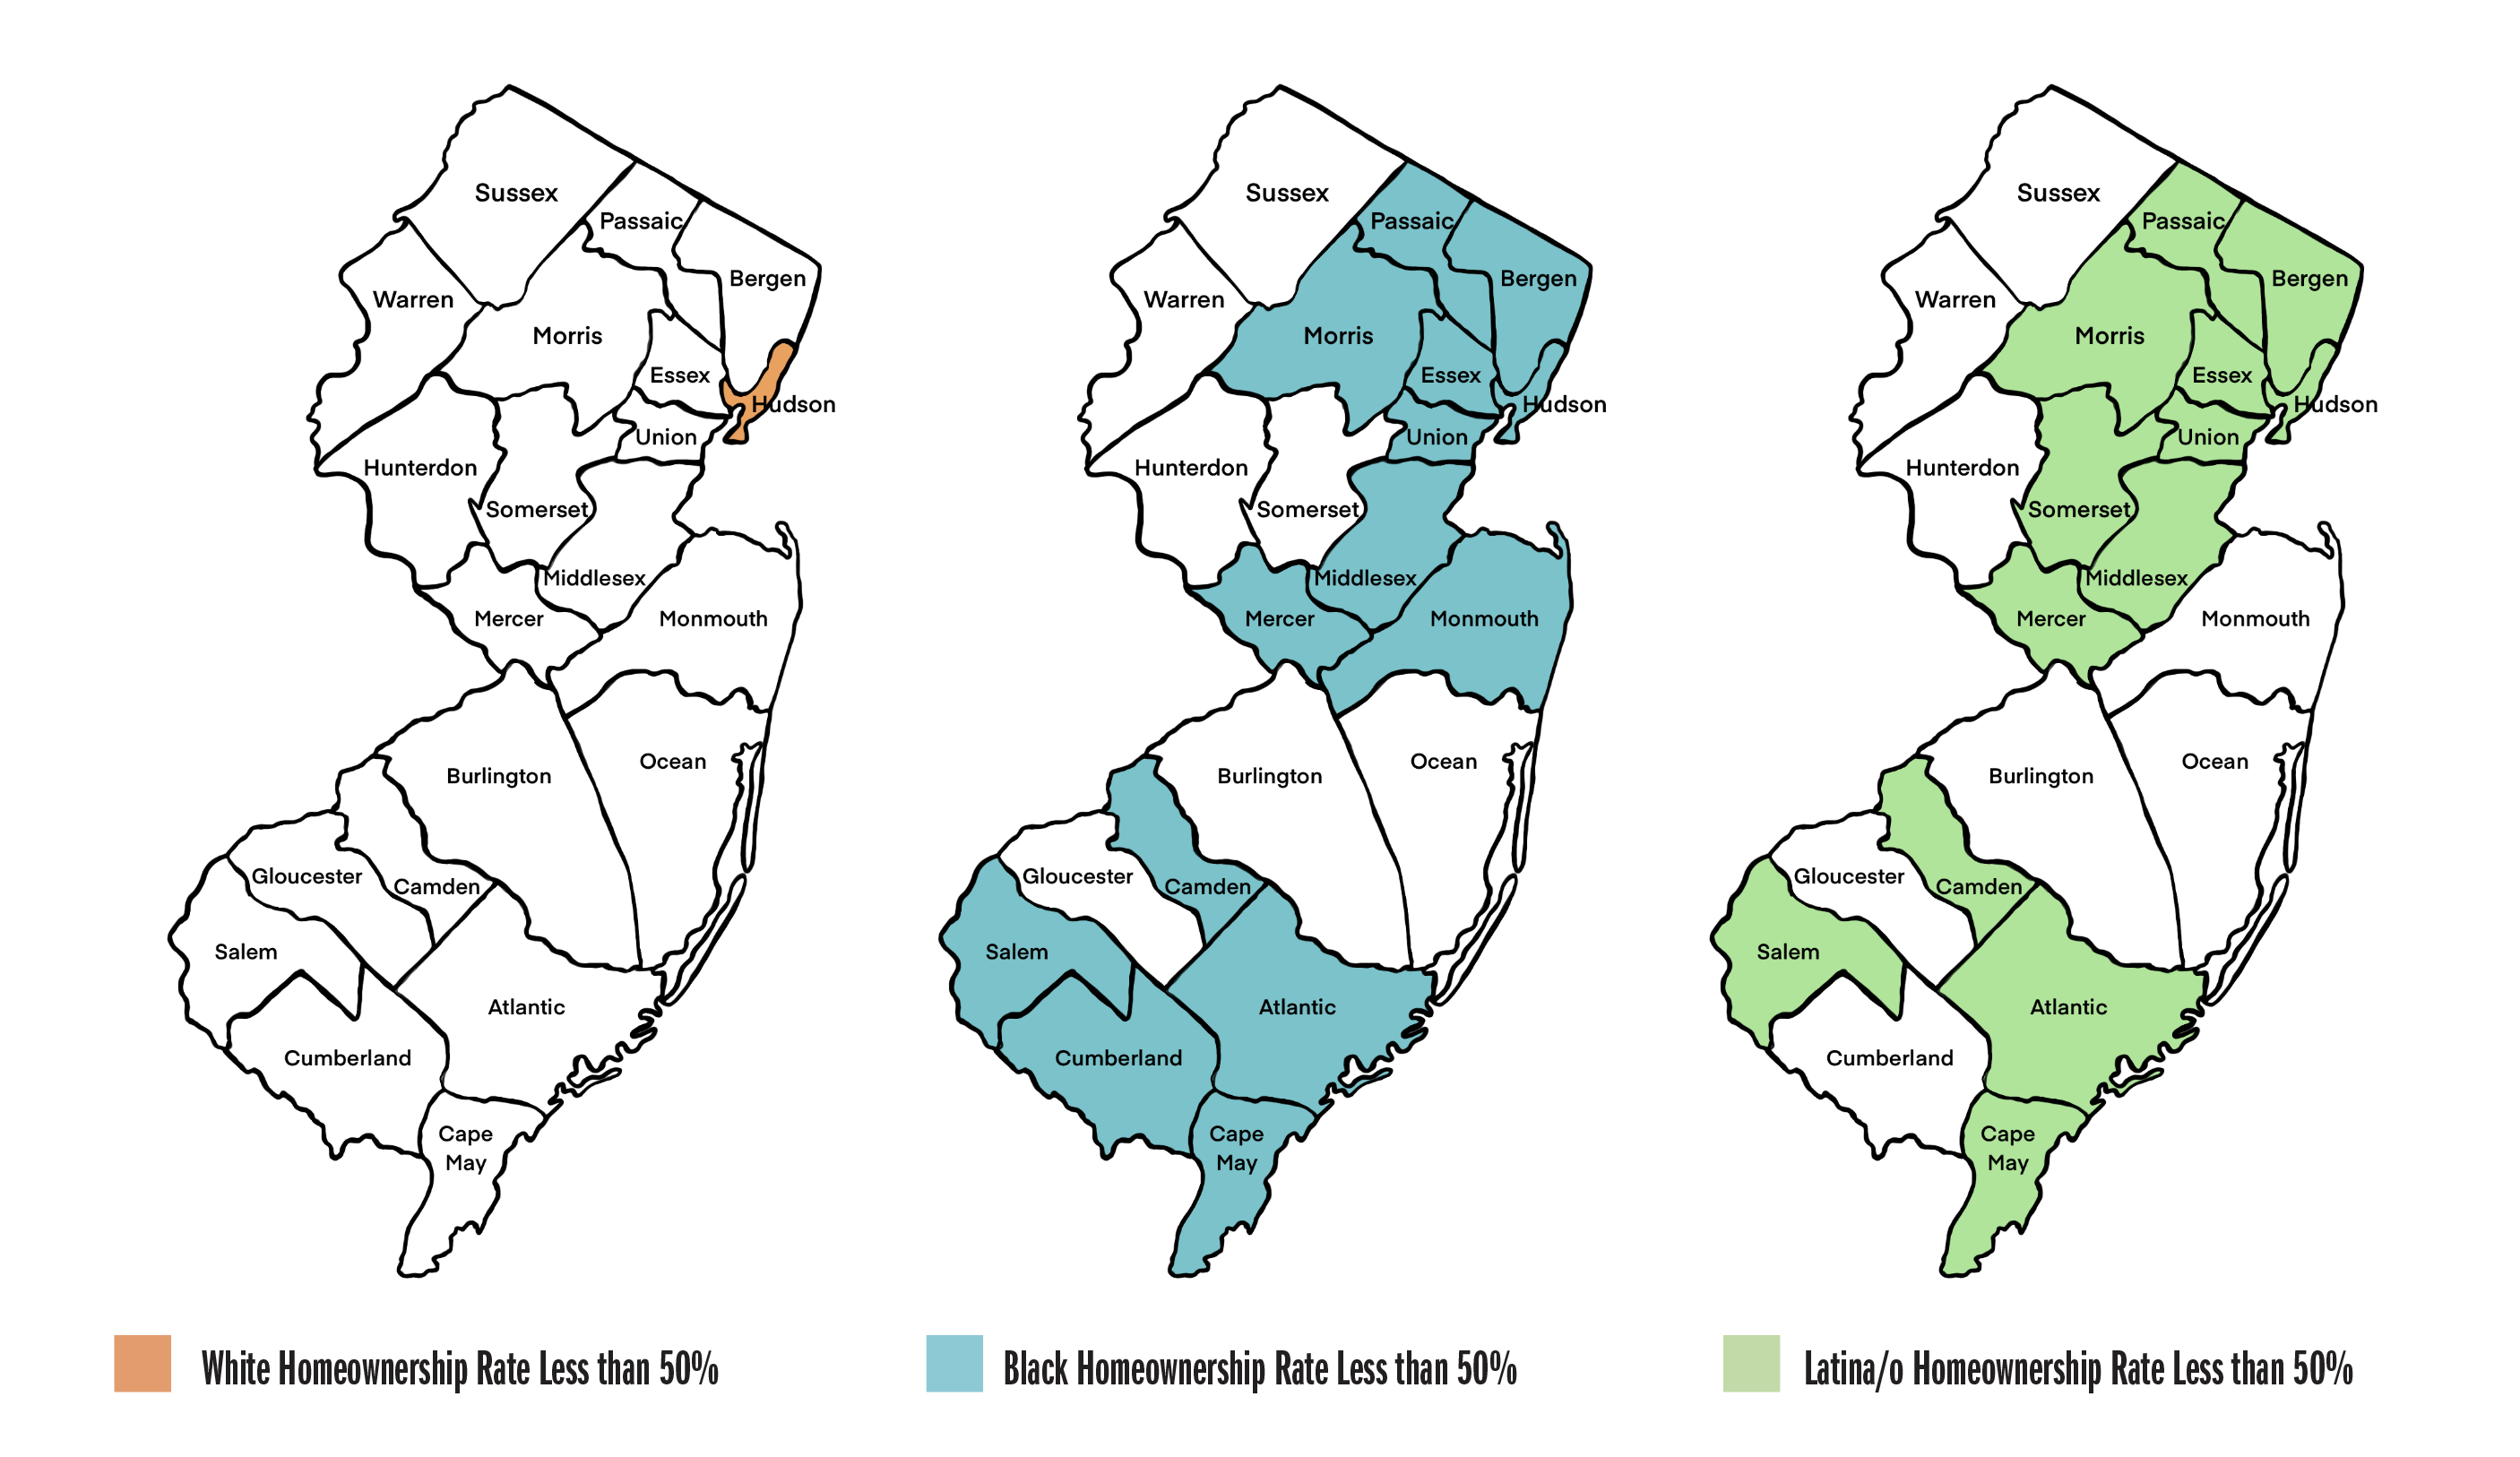
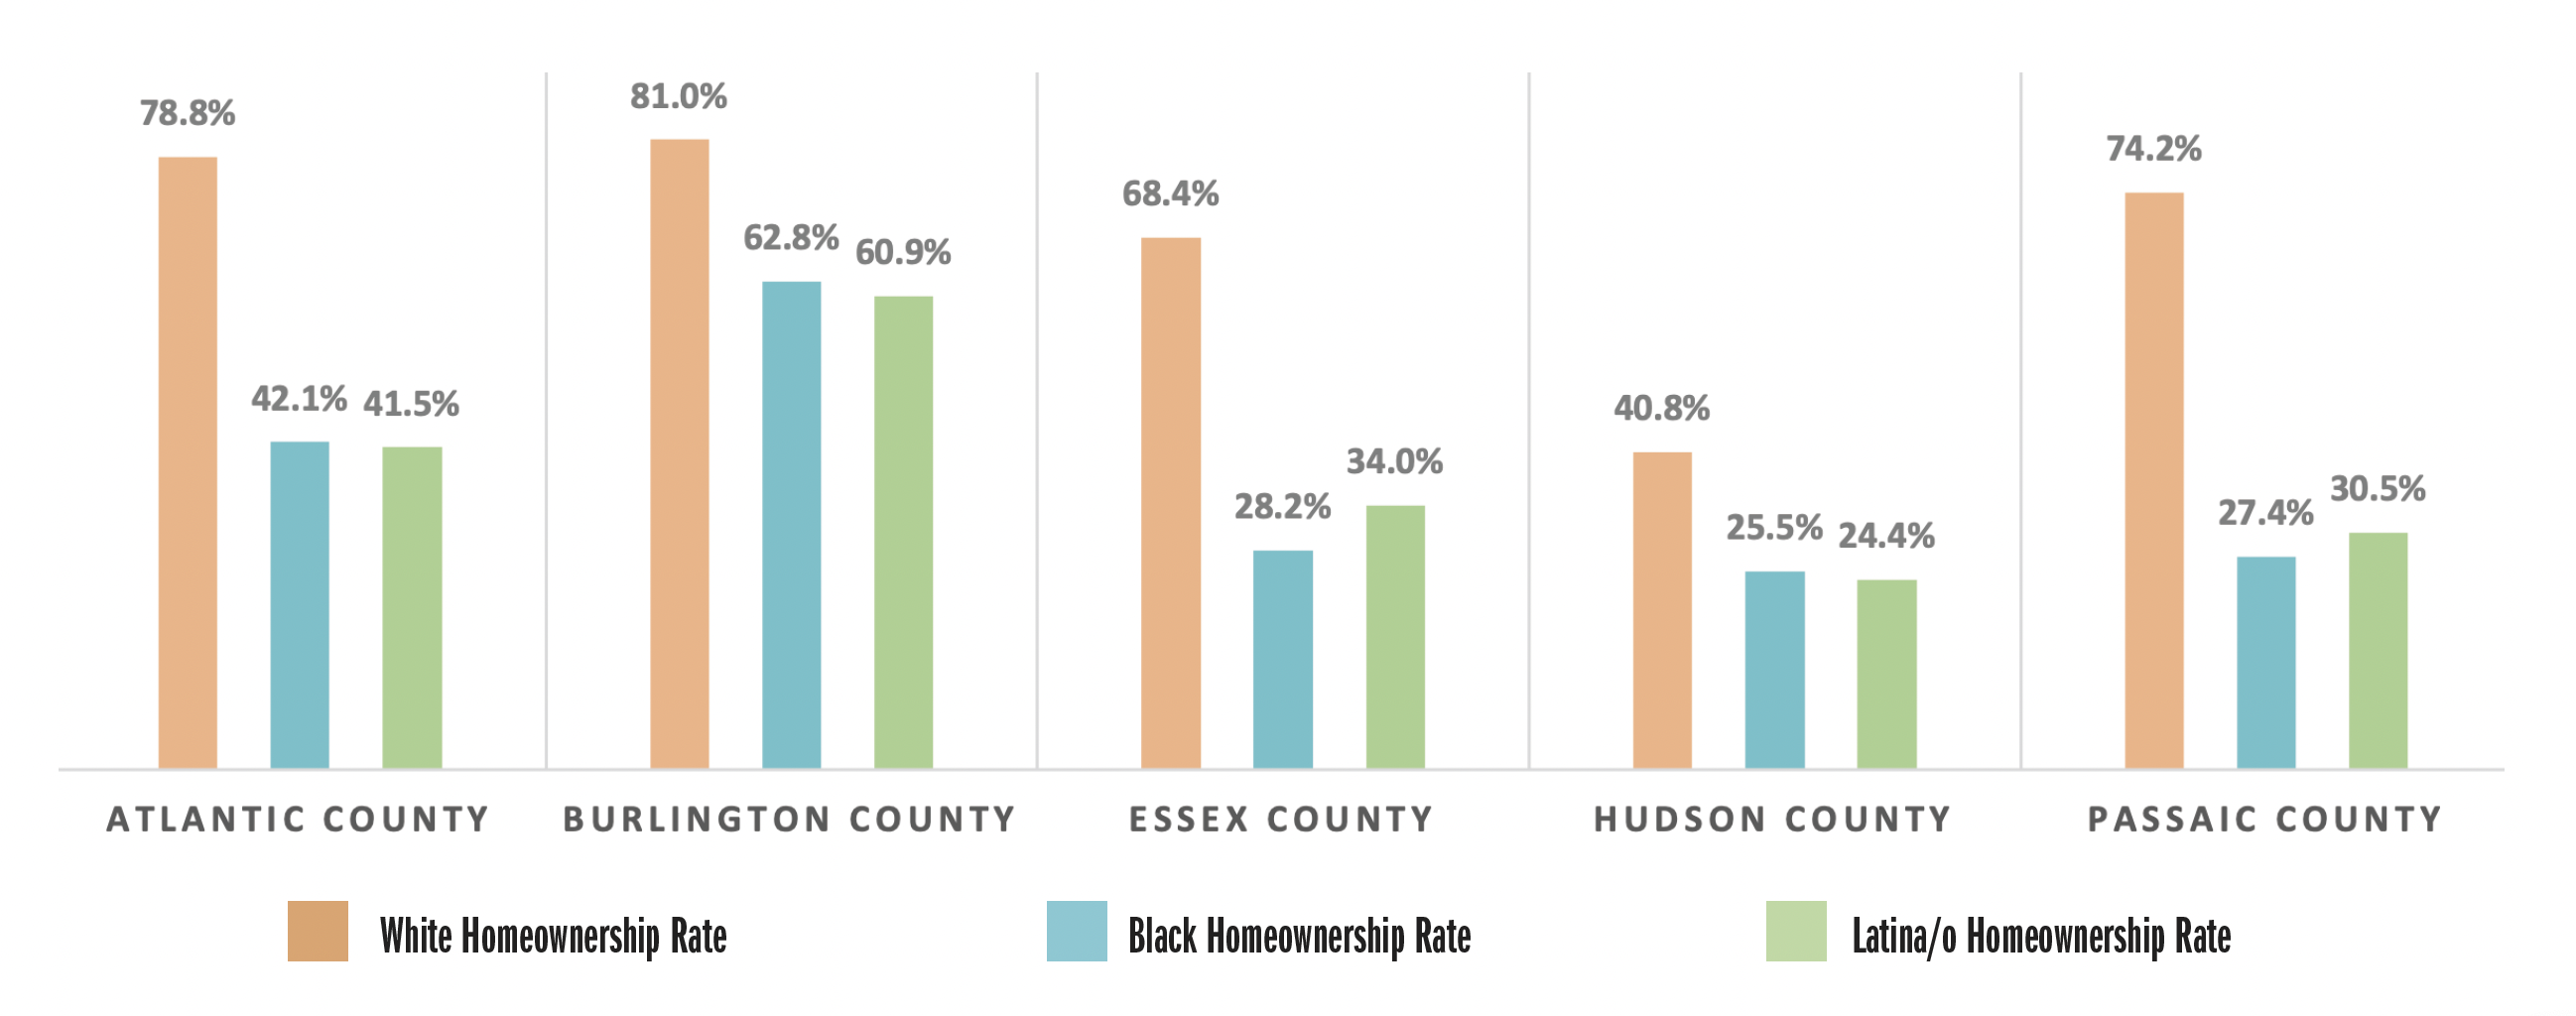
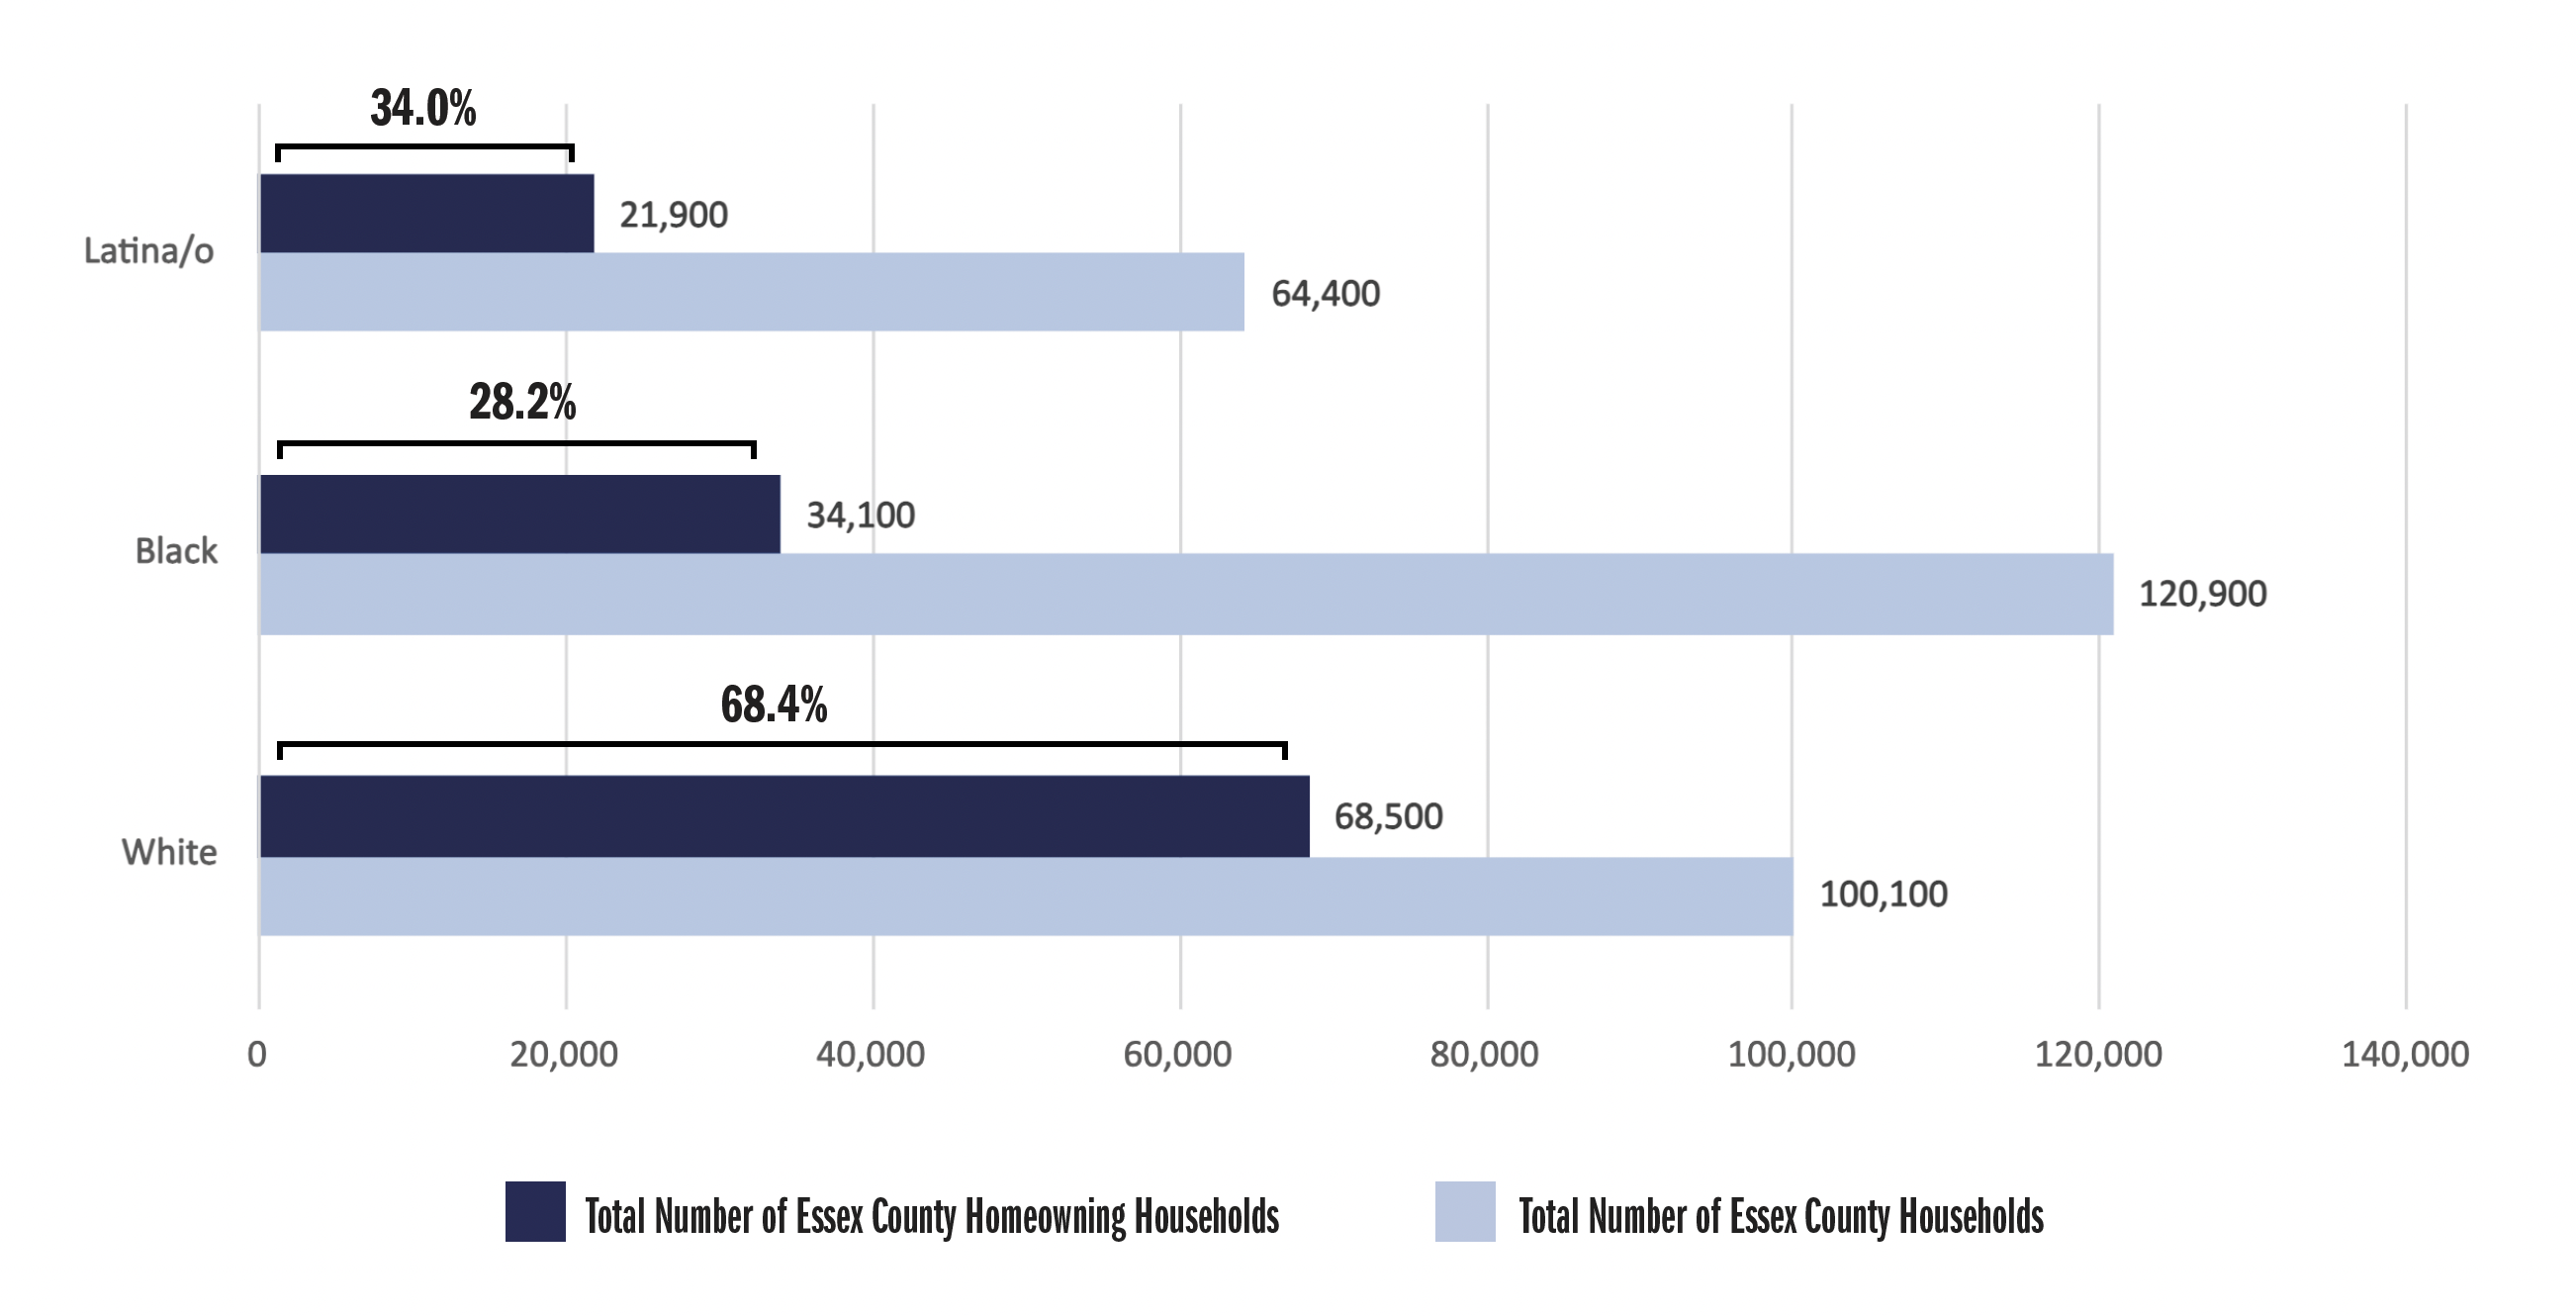
The answer is that New Jersey was designed this way during its founding as a colony. A direct line can be drawn from the state’s history of slavery through generations of structural racism to the inequities experienced by New Jersey’s Black and other communities of color today. The ongoing impacts are felt when it comes to disparities in homeownership, income, poverty, uninsured rates and the digital divide. When looking deeply into all of New Jersey’s counties as this report does, it becomes clear that a person’s race and zip code often determine outcomes in all these areas.
Building on our previous reports, Making the Two New Jerseys One and The Two New Jerseys by the Numbers, each of which examined New Jersey’s racial wealth gap from a statewide perspective, this brief provides new, county-level data to help understand the impact of the racial wealth gap in the everyday lives of Black and other families of color in New Jersey.
This difficult reality presents an important opportunity to finally confront New Jersey’s history of slavery and its enduring legacy, and to design an equitable, racially just future for Black and other people of color in New Jersey.
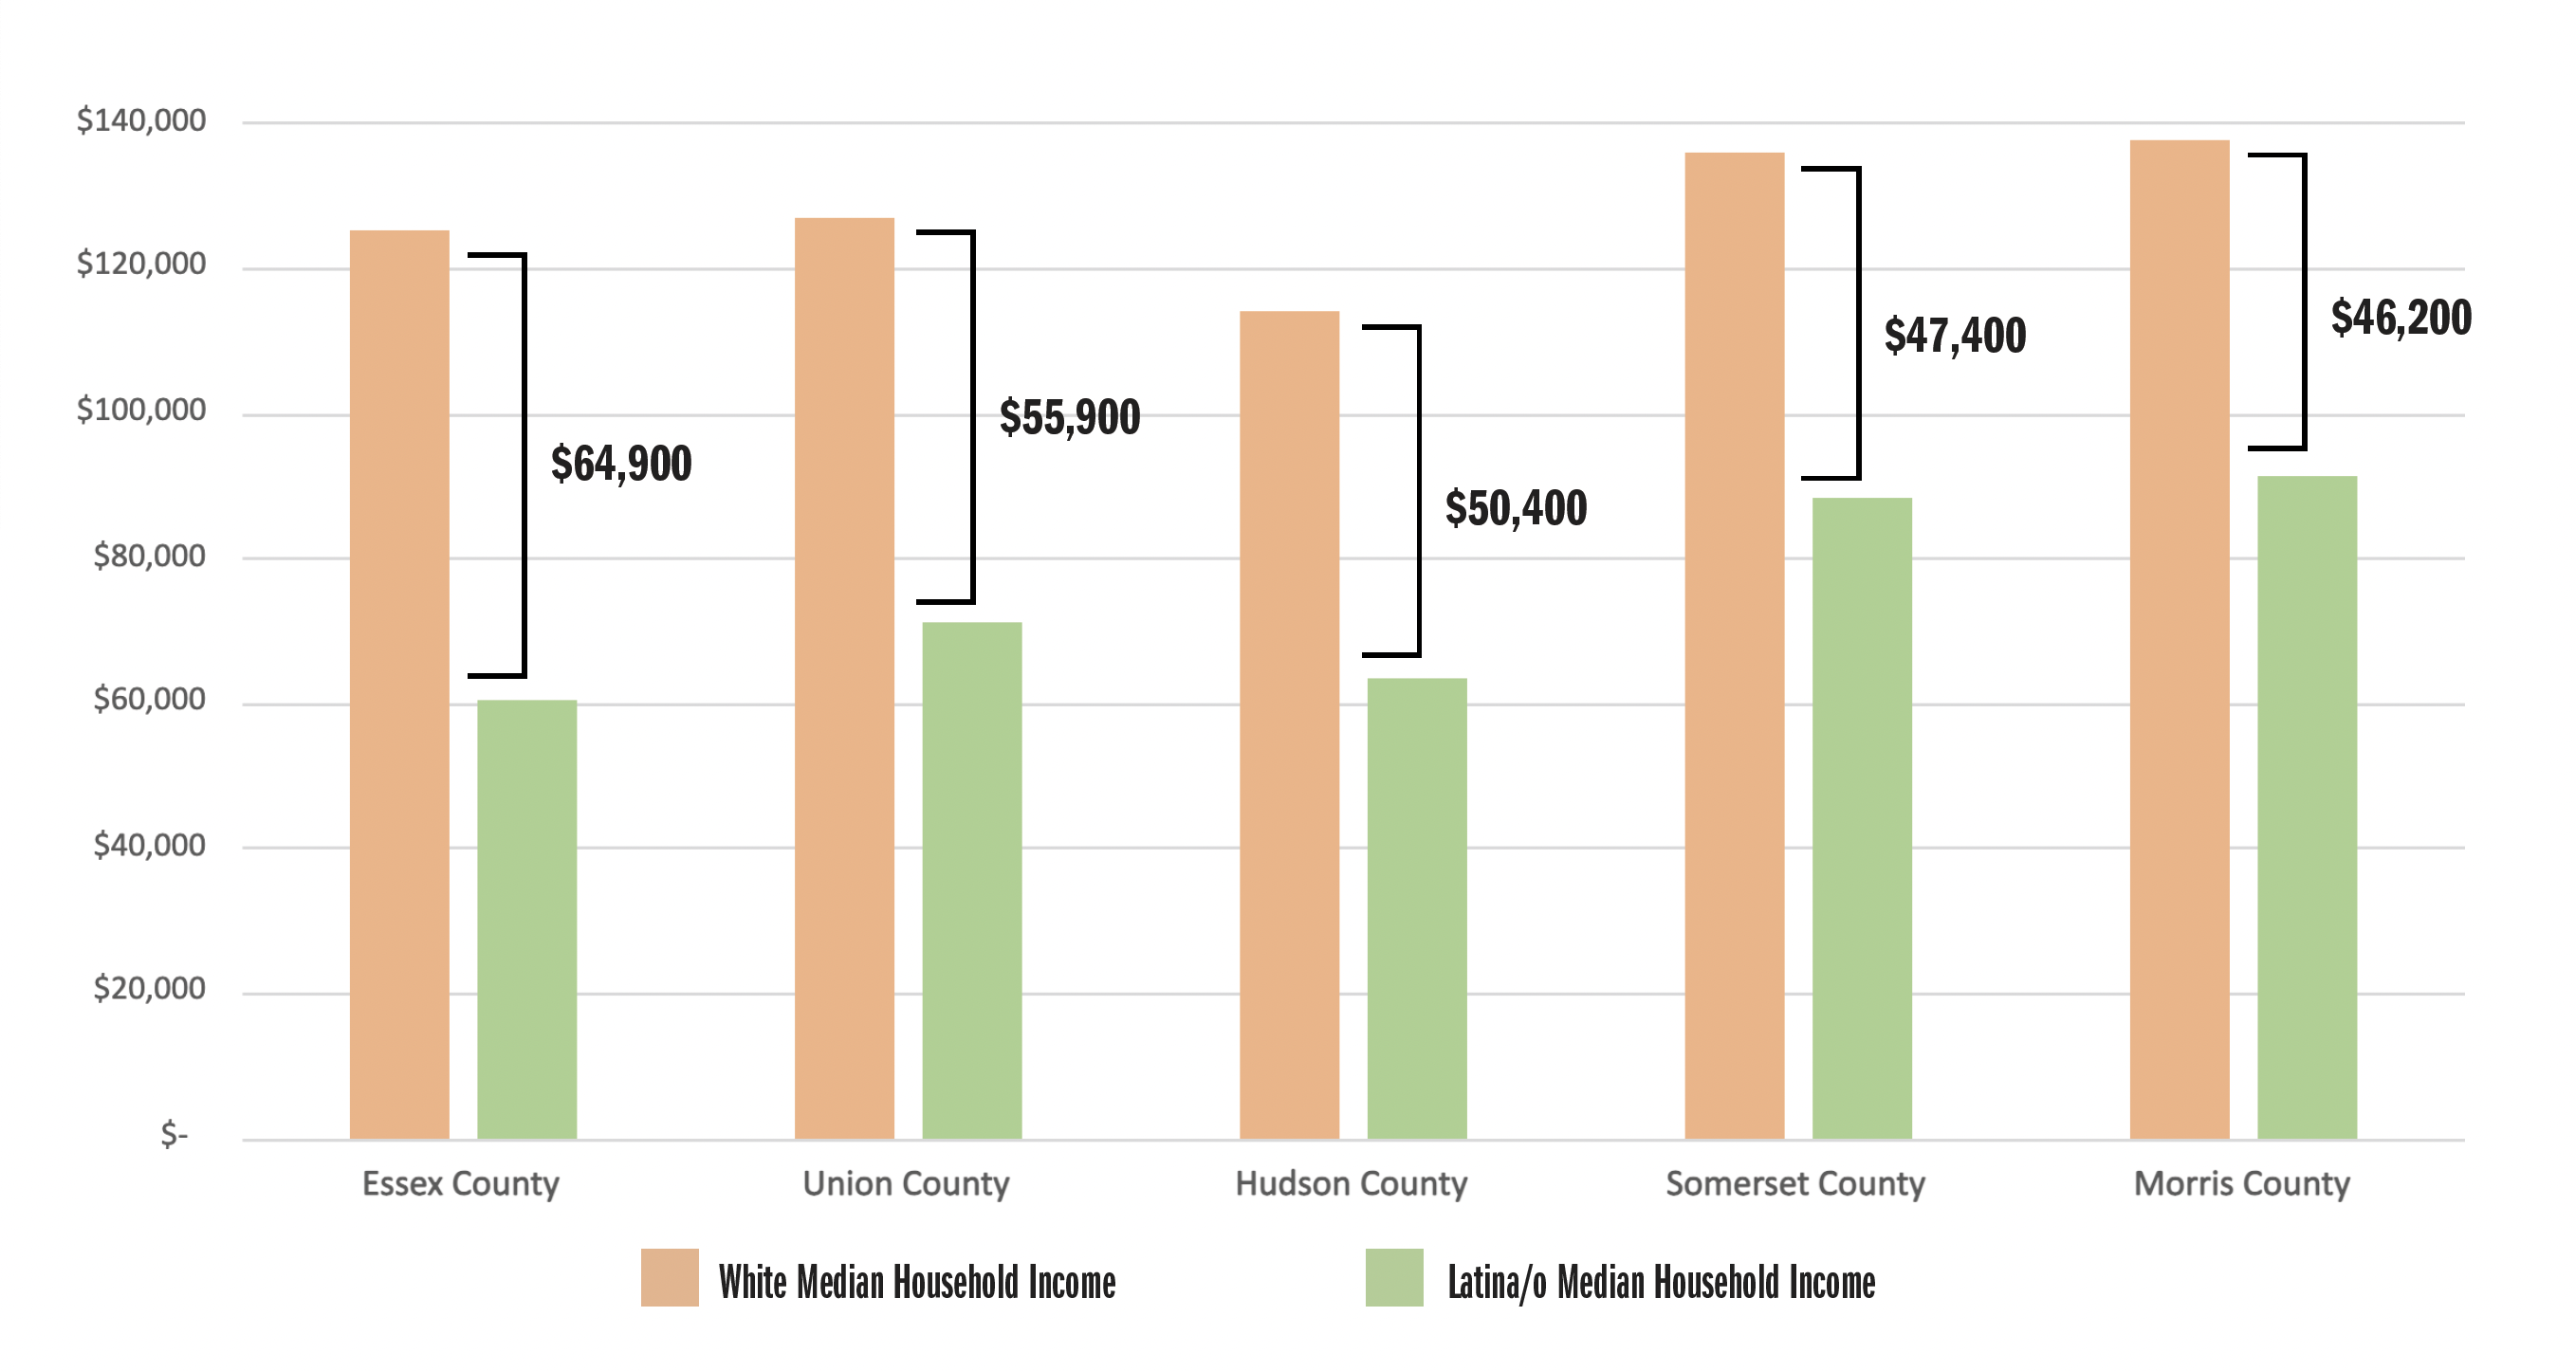
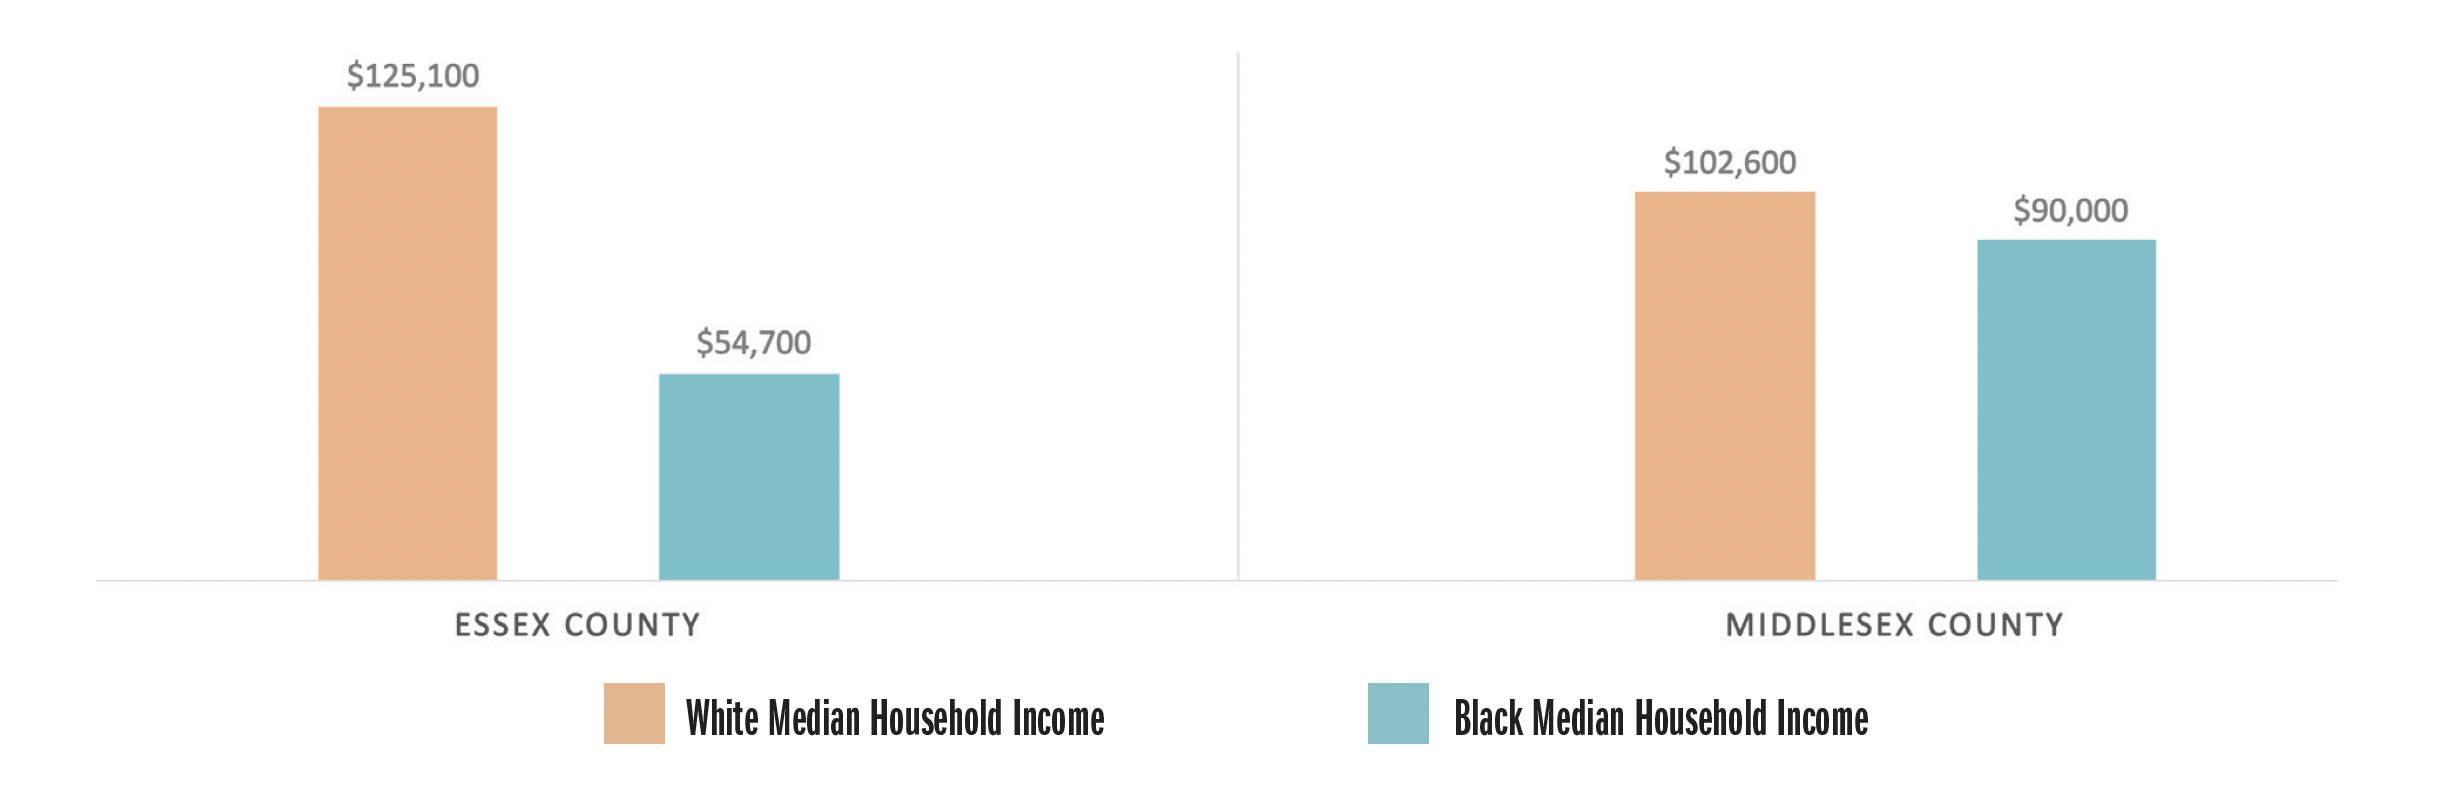
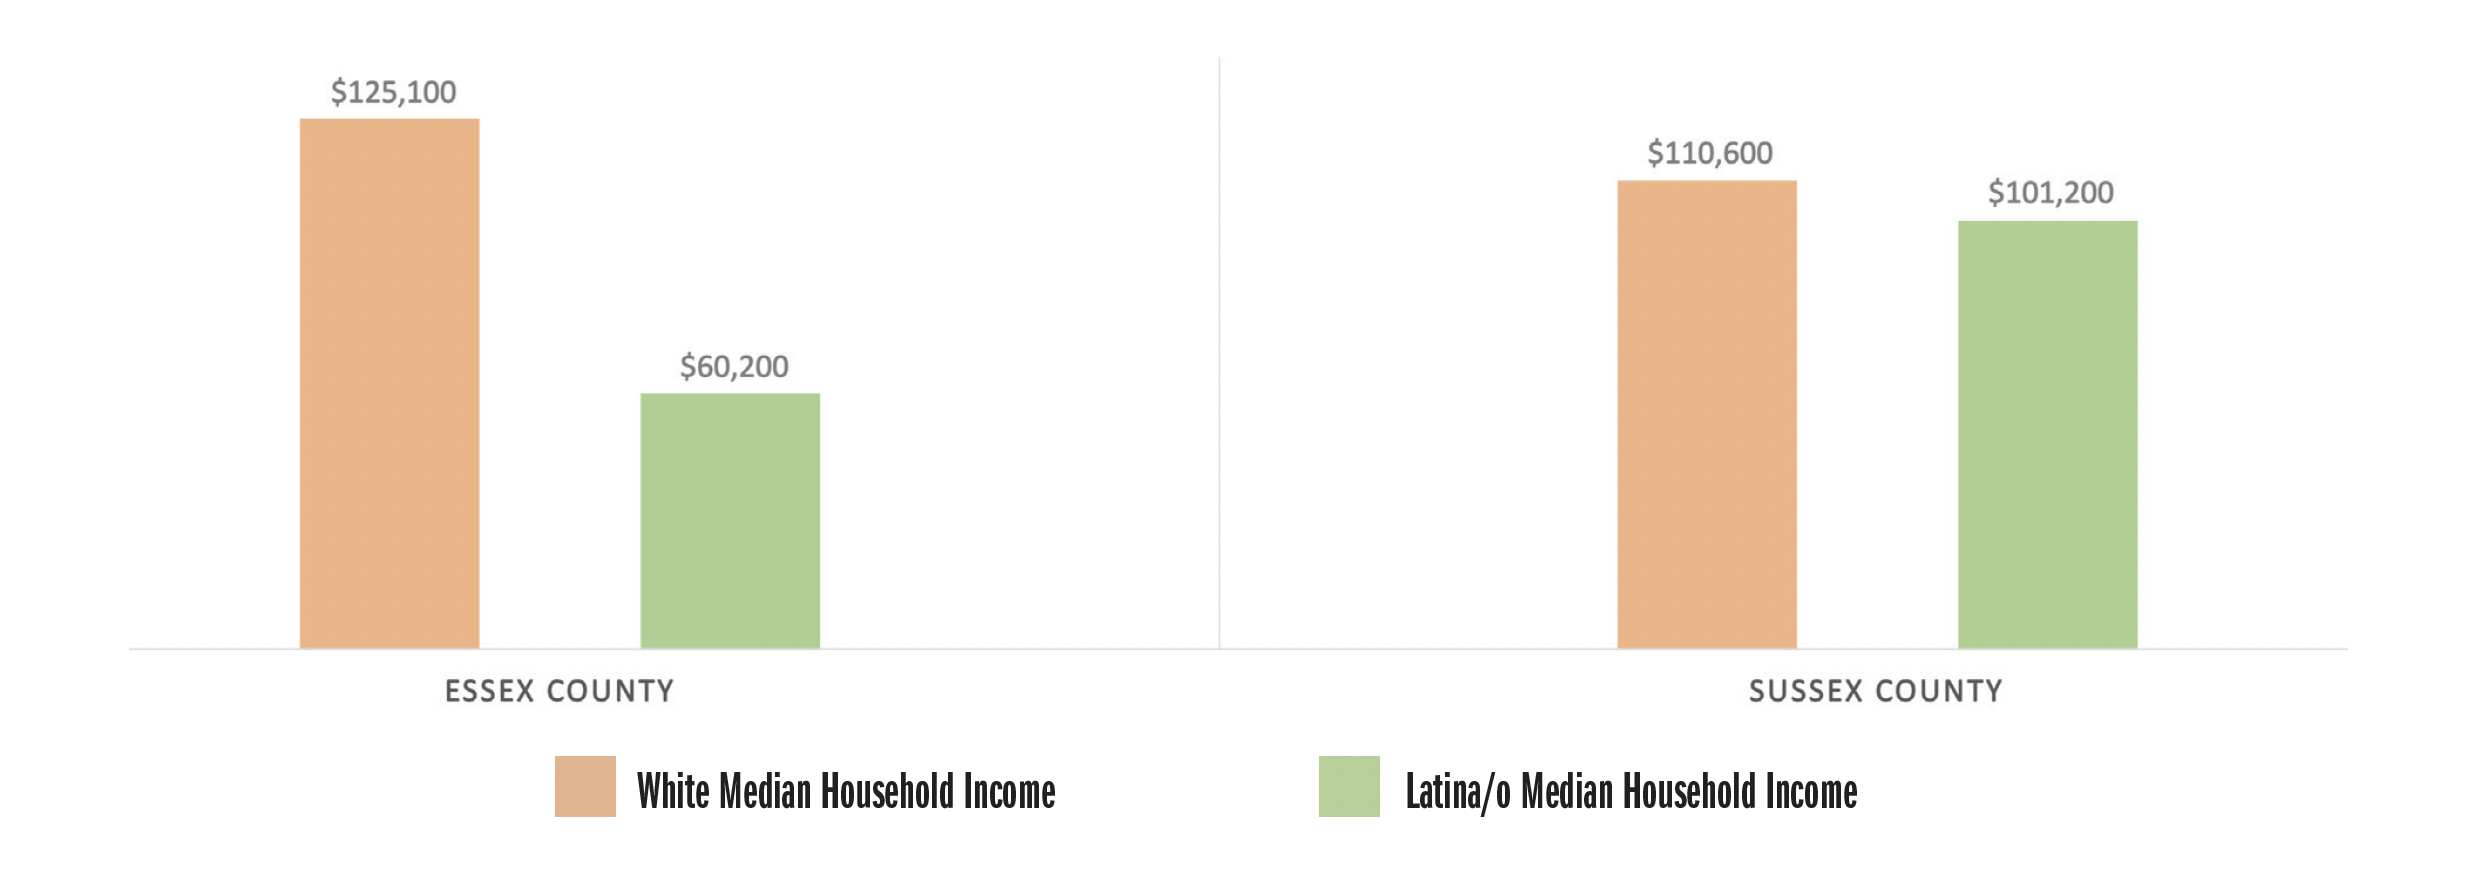
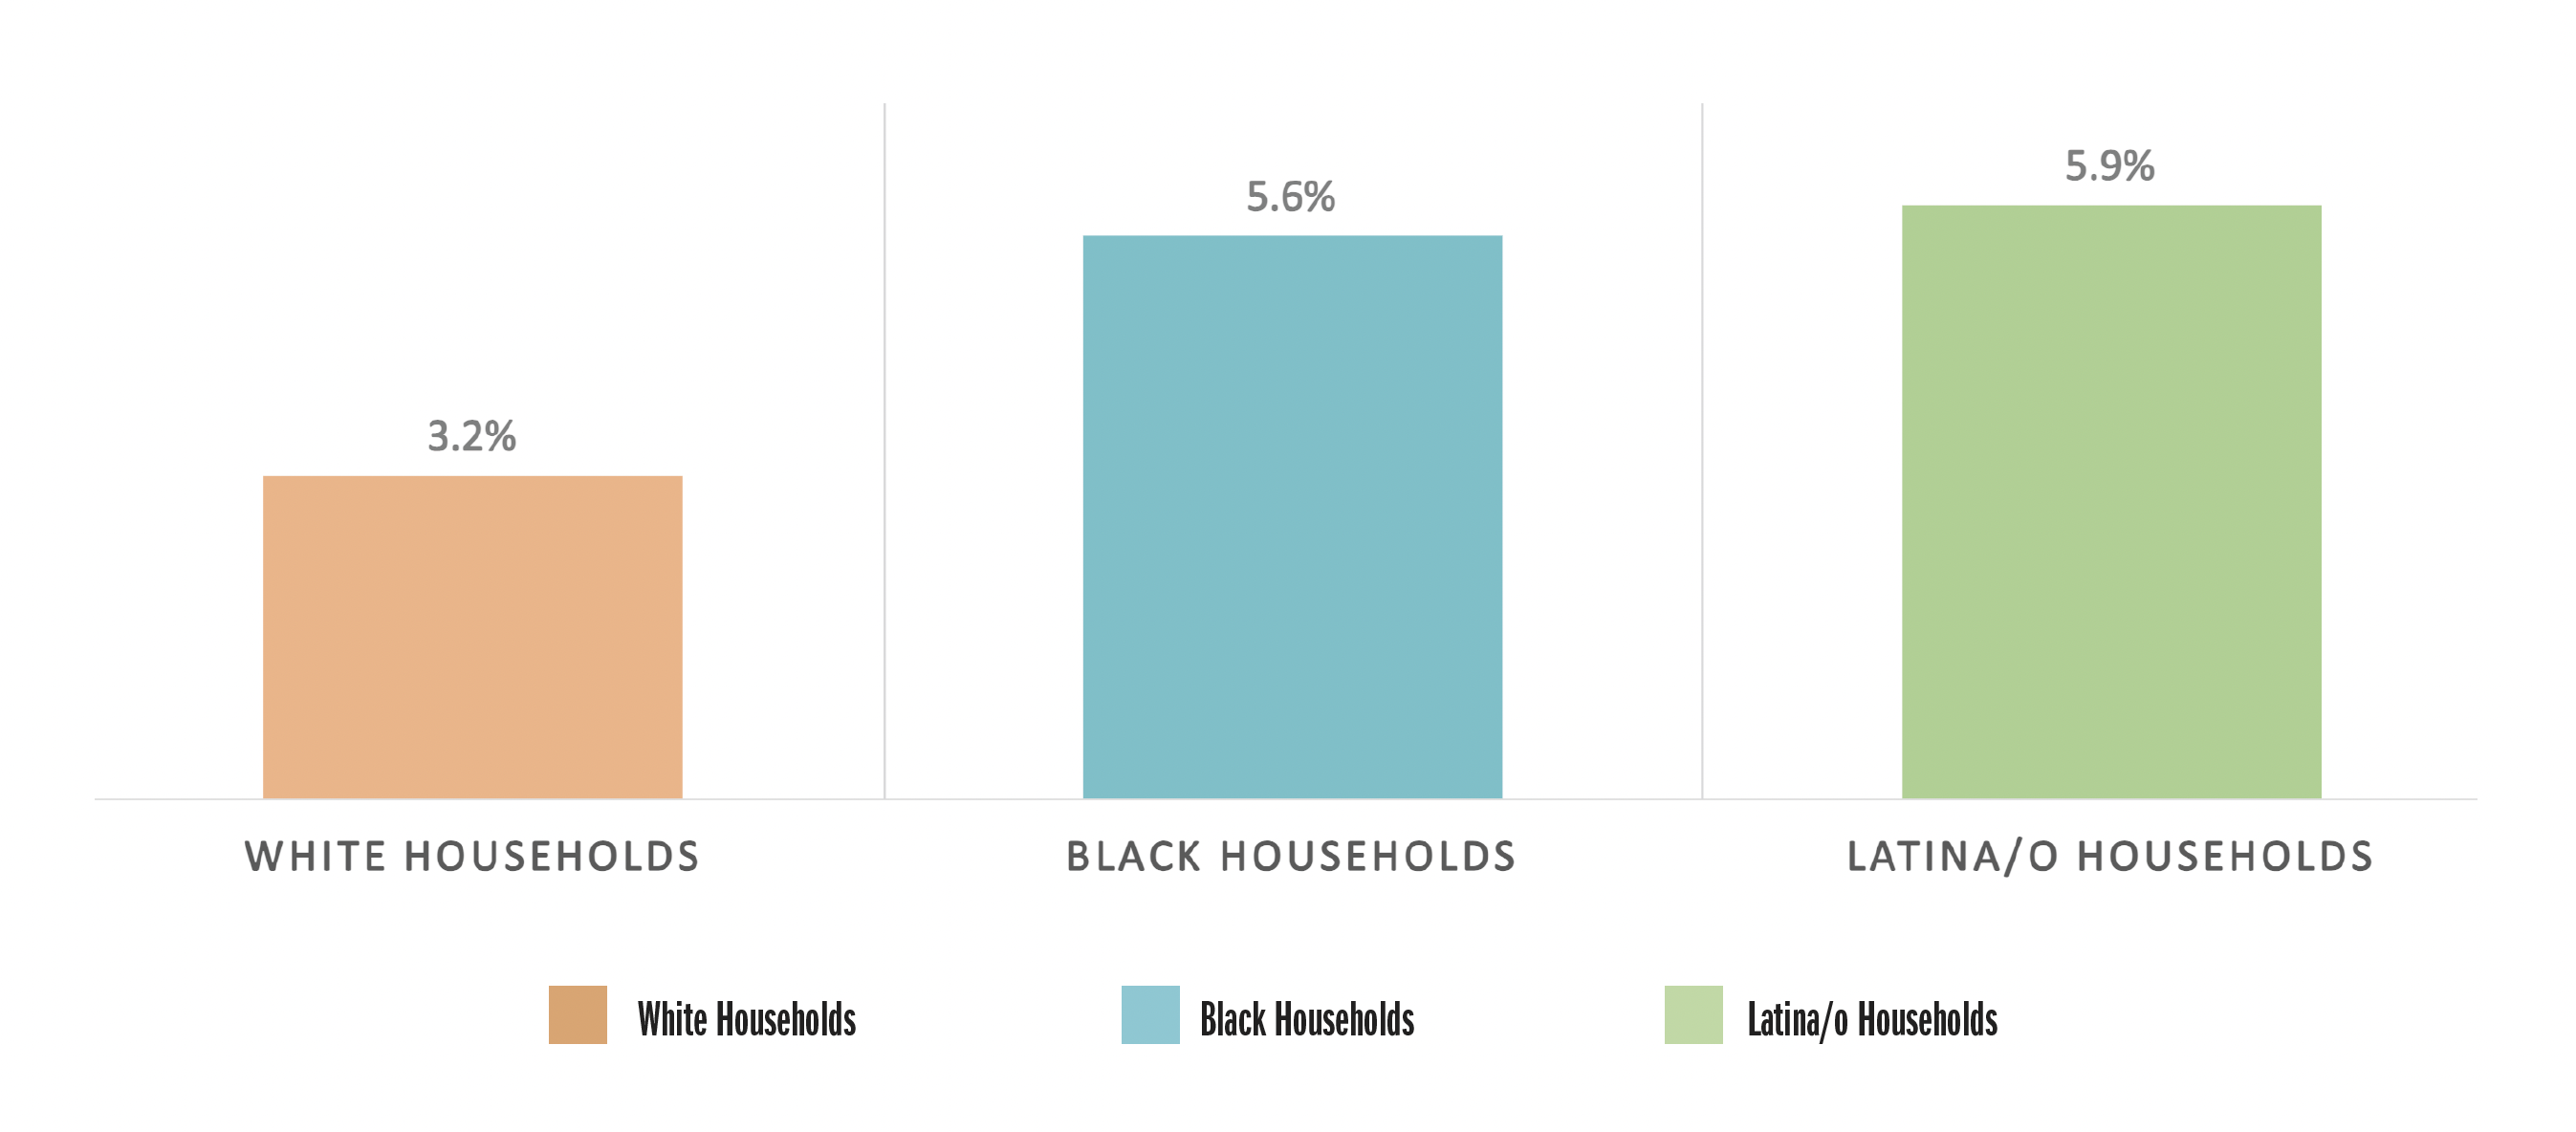
 Source: American Community Survey (ACS) 2022 5-year Estimates.
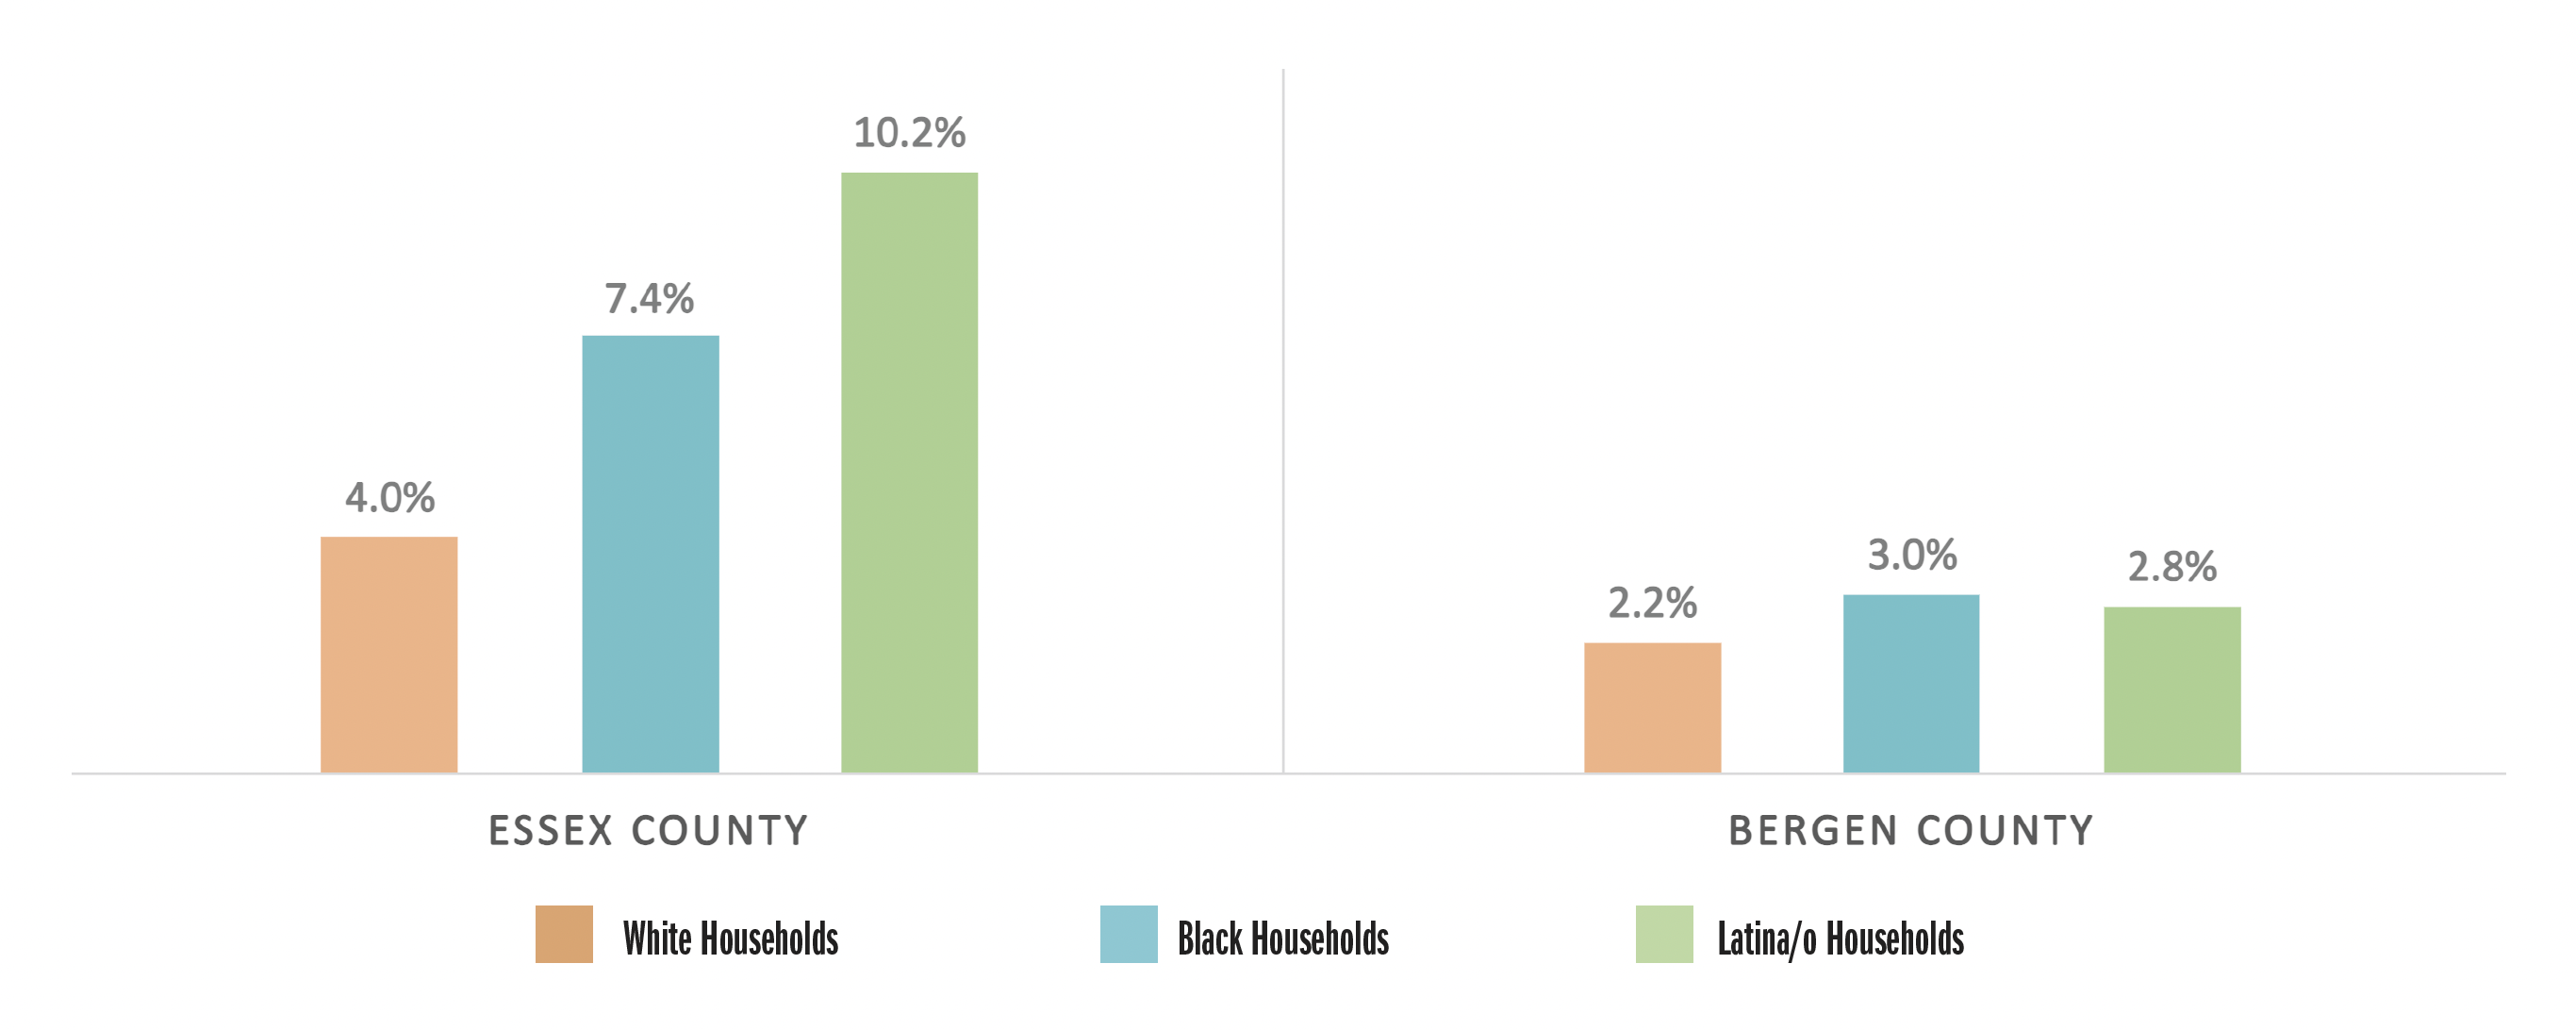
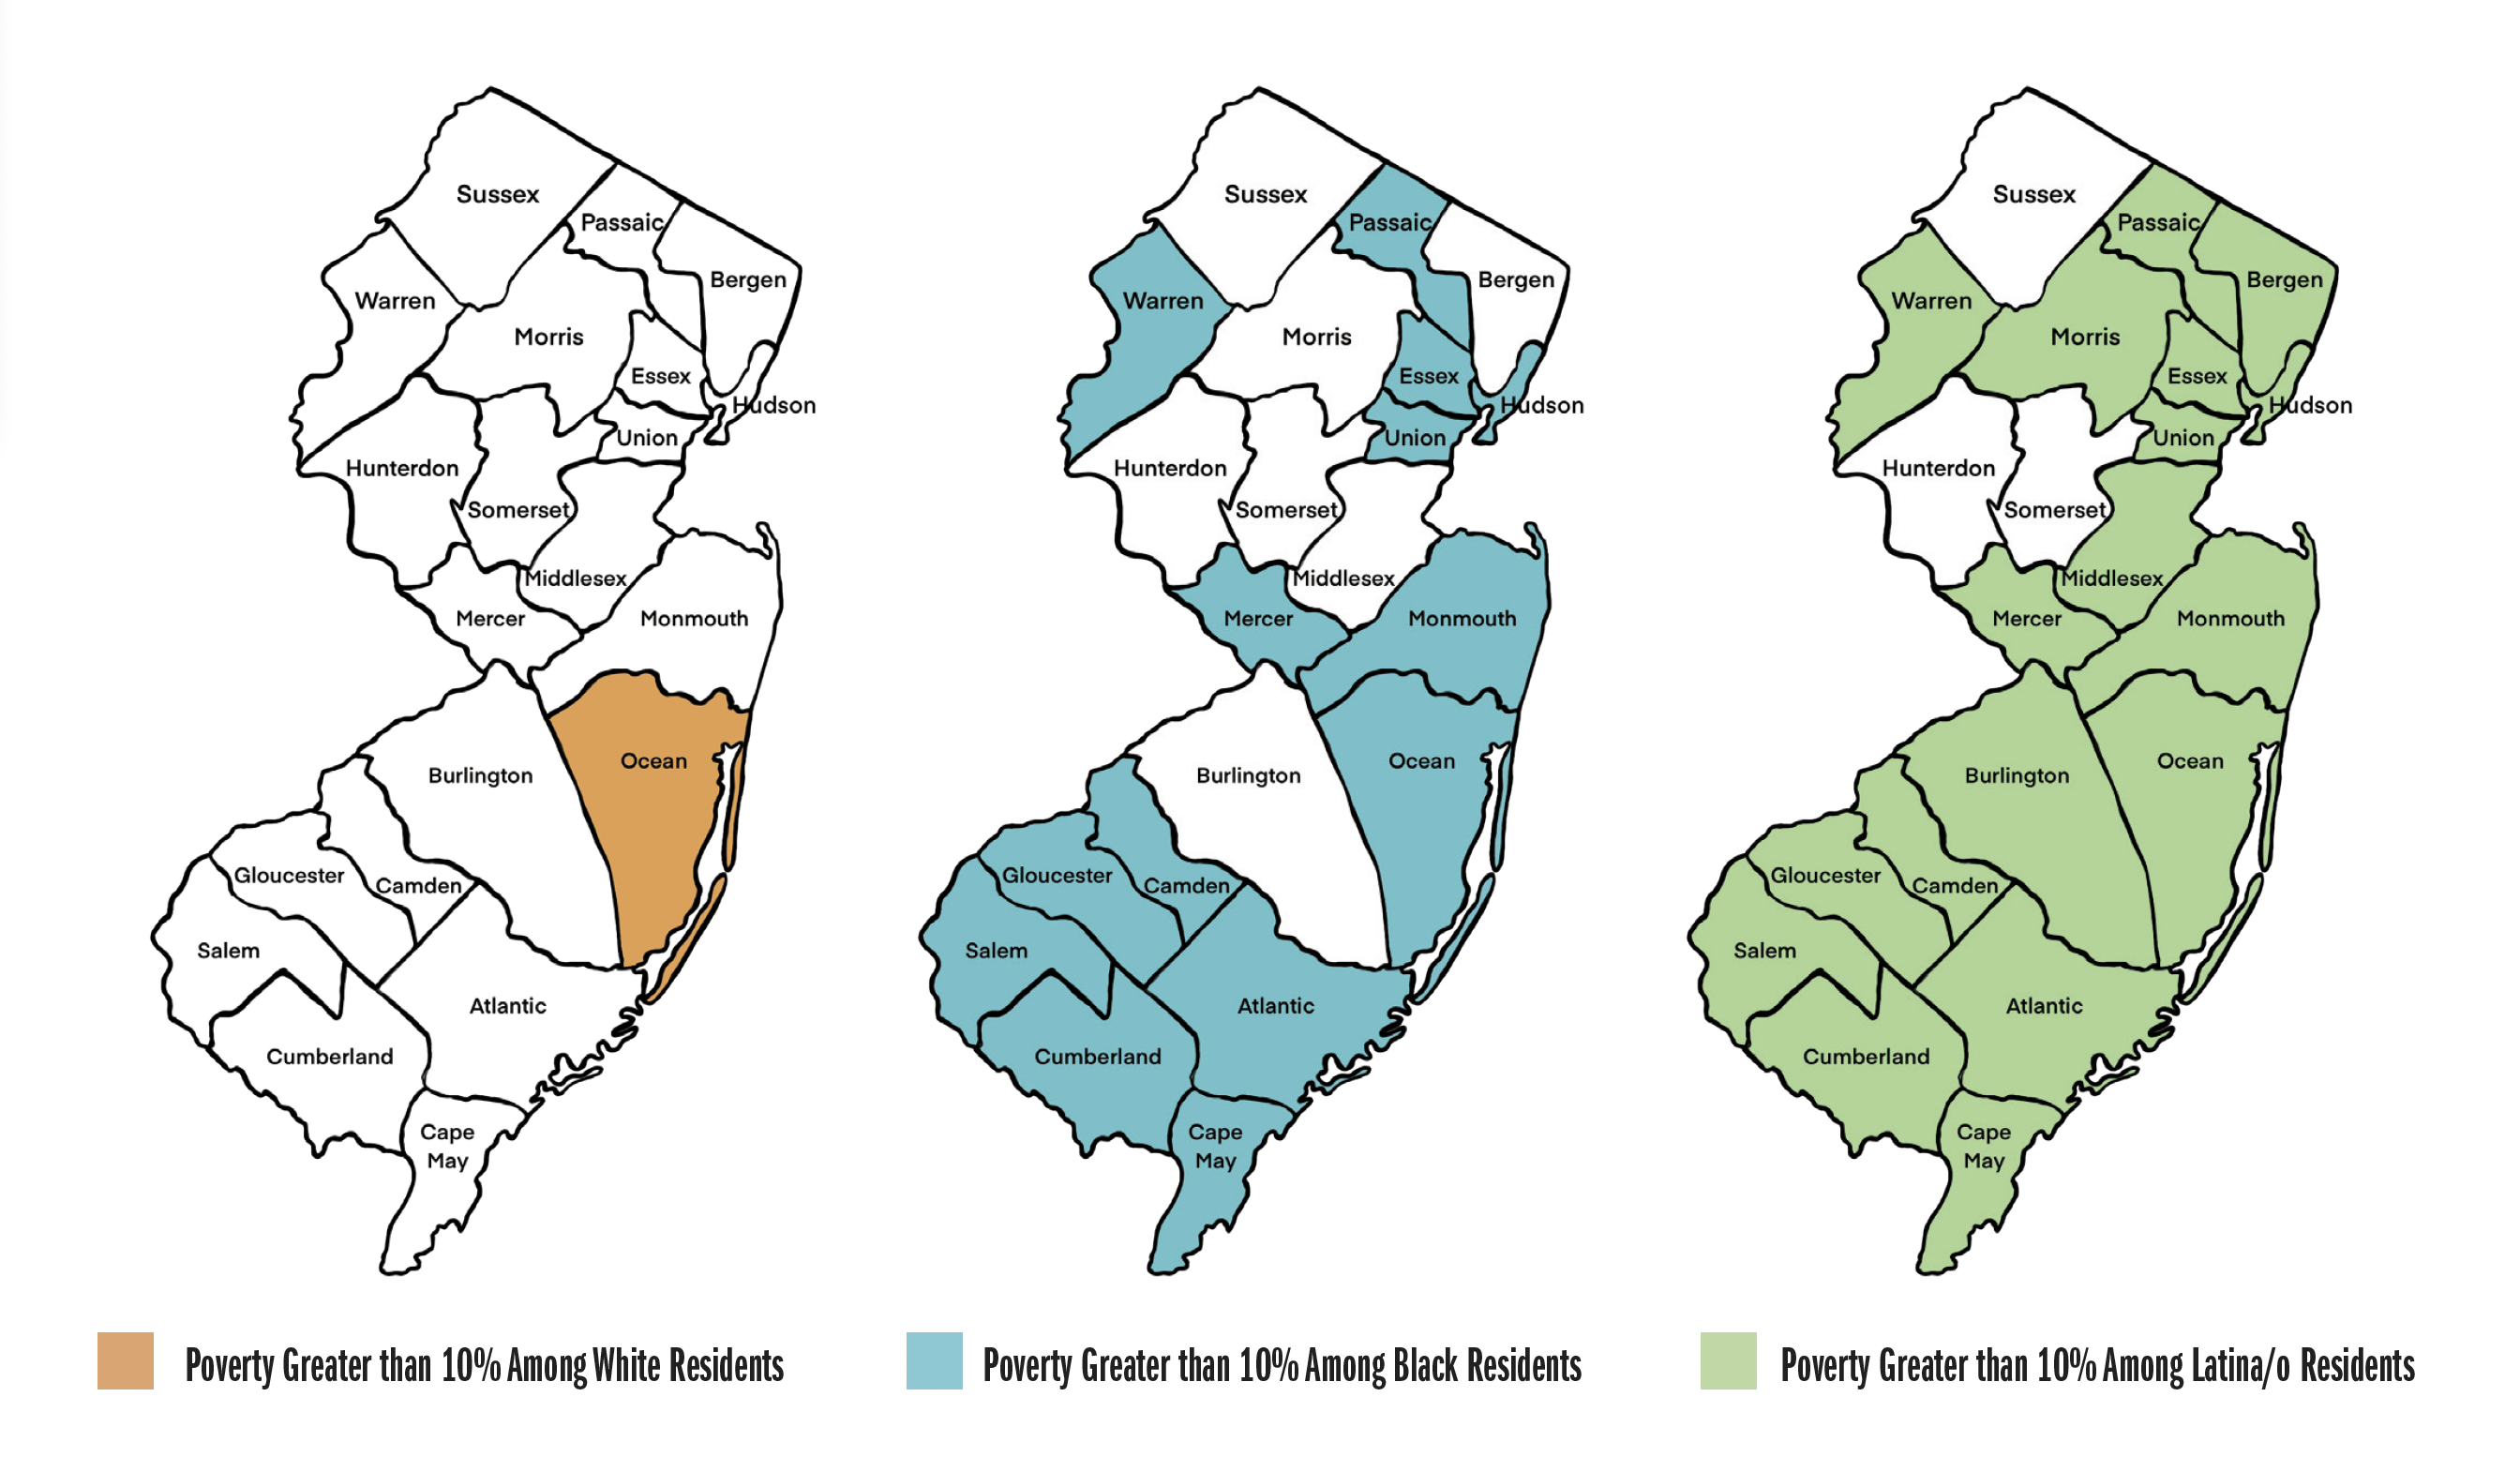